Download
1 / 8
100 likes | 511 Views
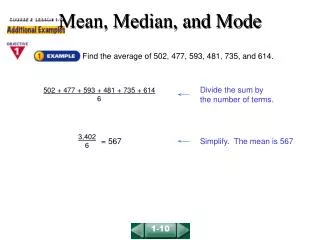
Mean, median and mode from a Bar Chart(3). Statistics. In a survey pupils were asked to count the number of books they carried to school in their bags. The results are shown in the bar chart. Use the bar chart to calculate the mean, median and mode.

E N D
Mean, median and mode from a Bar Chart(3) Statistics
In a survey pupils were asked to count the number of books they carried to school in their bags. The results are shown in the bar chart Use the bar chart to calculate the mean, median and mode. 3 4 5 6 7 8 9 Number of books
A survey was carried out to see how many pupils were using the school bus. The number on the bus each day was recorded and the results are shown in the bar chart. Use the bar chart to calculate the mean, median and mode. 8 9 10 11 12 13 14 Number of pupils on the bus each day
A company produce boxes of matches. They claim that on average there are more than 62 matches in a box. To check their claim a number of boxes were opened and the matches counted. The results are shown in the bar chart Use the bar chart to calculate the mean. Is the claim Justified? 60 61 62 63 64 65 66 Number of matches in a box
A record was kept of the number of pupils absent from class over a period of time. The results are shown in the bar chart. Use the bar chart to calculate the mean, median and mode. 1 2 3 4 5 6 Number of pupils absent from class.
The police did a survey to see how many people were present in cars on a busy road. The results are shown in the bar chart. Use the bar chart to calculate the mean, median and mode. 1 2 3 4 5 Number of people in a car
Throughout the month of August last year the number of hours of sunshine was recorded each day. The results are shown in the bar chart. Use the bar chart to calculate the mean, median and mode. 6 7 8 9 10 Hours of sunshine in a day
An athlete is training for a distance run. Each day he records how far he has run and the results are shown. The athlete claims he is running an average of at least 13 miles per day. Is his claim justified? Use the bar chart to calculate the mean. 10 11 12 13 14 15 16 17 Number of miles run in a day.