Download

1 / 23
240 likes | 551 Views
GCSE Unit 3. Models and skills. Economic Change. The Clark-Fisher model showing changes in employment in different sectors as a country develops. Employment structure for selected countries with different levels of economic development. Choropleth map page 70 (Skill book)

E N D
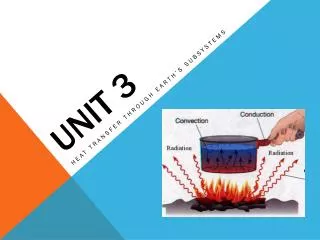
GCSE Unit 3 Models and skills
The Clark-Fisher model showing changes in employment in different sectors as a country develops.
Employment structure for selected countries with different levels of economic development.
Choropleth map page 70 (Skill book) Shaded according to a key Advantages:easy to complete Shows a good visual impression of change over space Disadvantages: Variations within units are concealed Gives a false impression of abrupt changes at boundaries
Compound line graph Changes over time Continuous data Shows multiple sets of data.
The Demographic Transition model P234 The specific characteristics of each stage have to be learned from book
RAPID GROWTH LEDCs e.g. Kenya Stage 2 of DTM: Decreasing death rate, especially infant mortality. However, narrow top= still shorter life expectancy than MEDCs. Wide base= large number of dependent children high level of fertility . Continuous decrease of % of pop for each age group, especially between 0-4 and 5-9 shows that infant mortality is still important
SLOW GROWTH • Stage 4 of DTM e.g. USA • Oblong-like structure. • Narrow base: low BR • Bulge between the ages of about 30 to 50: reflects economic expansion late 1950s and 1960s [baby boom] • Wider top: long life expectancy [higher for women] • Ageing population
NEGATIVE GROWTH • Stage 5 of DTM, e.g. Germany • Age group 0-4 less than 5-9:Declining birth rate • Bulge 25-45 age groups: children of immigrants after the Second World War • Ageing population: high % of pop above 60, long life expectancy [higher for women]
Section B A Tourist’s World