Download
1 / 44
440 likes | 445 Views
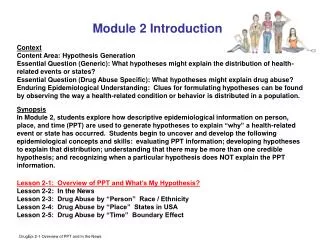
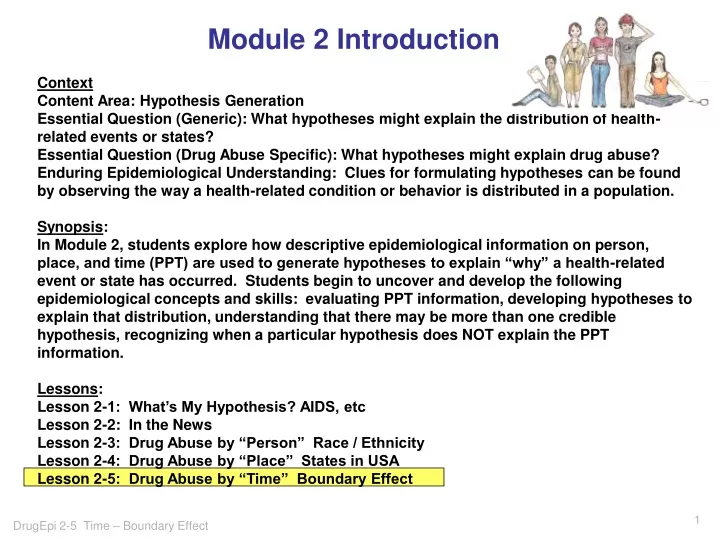
Module 2 Introduction Context Content Area: Hypothesis Generation Essential Question (Generic): What hypotheses might explain the distribution of health-related events or states? Essential Question (Drug Abuse Specific): What hypotheses might explain drug abuse?

E N D
Module 2 Introduction Context Content Area: Hypothesis Generation Essential Question (Generic): What hypotheses might explain the distribution of health-related events or states? Essential Question (Drug Abuse Specific): What hypotheses might explain drug abuse? Enduring Epidemiological Understanding: Clues for formulating hypotheses can be found by observing the way a health-related condition or behavior is distributed in a population. Synopsis: In Module 2, students explore how descriptive epidemiological information on person, place, and time (PPT) are used to generate hypotheses to explain “why” a health-related event or state has occurred. Students begin to uncover and develop the following epidemiological concepts and skills: evaluating PPT information, developing hypotheses to explain that distribution, understanding that there may be more than one credible hypothesis, recognizing when a particular hypothesis does NOT explain the PPT information. Lessons: Lesson 2-1: What’s My Hypothesis? AIDS, etc Lesson 2-2: In the News Lesson 2-3: Drug Abuse by “Person” Race / Ethnicity Lesson 2-4: Drug Abuse by “Place” States in USA Lesson 2-5: Drug Abuse by “Time” Boundary Effect
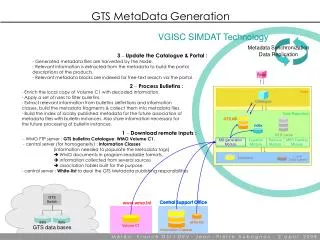
Module 2 - Hypothesis Generation • Lesson 2-5 Drug Abuse by “Time” Boundary Effect • Content • Brief review of descriptive epidemiology factors of person, place, and time • “Time” trends in the Monitoring the Future data 1976-2006 • “Time” trends in admissions to treatment • An investigation of the effect of “week of the month” as a “time” variable, regarding deaths in the USA • Discussion of hypotheses that are generated from “time” information • Big Ideas • “Time” information can generate hypotheses • Cyclical time trends in drug use over the past 30 years suggest hypotheses about time-related fluctuations in attitudes about drug use, extent of active prevention programs, and types of illicit substances that are available. • Some causes of death are more common in the first week of the month; this suggests hypotheses about relationships between death and availability of money to purchase illicit substances. This project is supported by a Science Education Drug Abuse Partnership Award, Grant Number 1R24DA016357-01, from the National Institute on Drug Abuse, National Institutes of Health.
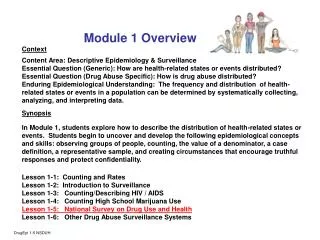
Where are we? Essential Questions Enduring Understandings Health-related conditions and behaviors are not distributed uniformly in a population. They have unique distributions that can be described by how they are distributed in terms of person, place, and time. 1. How is this disease distributed? 2. Clues for formulating hypotheses can be found by observing the way a health-related condition or behavior is distributed in a population. What hypotheses might explain the distribution of disease? 3. Is there an association between the hypothesized cause and the disease? Causal hypotheses can be tested by observing exposures and diseases of people as they go about their daily lives. Information from these observational studies can be used to make and compare rates and identify associations. 4. Is the association causal? Causation is only one explanation for finding an association between an exposure and a disease. Because observational studies are flawed, other explanations must also be considered. 5. What should be done when preventable causes of disease are found? Individual and societal health-related decisions are based on more than scientific evidence. Because of competing values, social, economic, and political factors must also be considered. 6. Did the disease prevention strategy work? The effectiveness of a strategy can be evaluated by making and comparing rates of disease in populations of people who were and were not exposed to the strategy. Costs, trade-offs and alternative strategies must also be considered.
Person (who?) Place (where?) Time (When?) Sex Residence Year Occupation Events Season Age Anatomical Site Day, etc. SES Geographic Site Onset Descriptive Epidemiology Epidemiological Factors
Sex Residence Year Occupation Events Season Age Anatomical Site Day, etc. SES Geographic Site Onset Descriptive Epidemiology - Time Epidemiological Factors Person Place Time
Descriptive Epidemiology - Time “Time” Can Mean “Years”
Hypotheses about Time Trends? • Perceived Risk • Disapproval • Public Attention • News Coverage / Advertisements • Drug-free campaigns and programs • Emergence of new, “attractive” substances • “Generational Forgetting”
Time Trends by Type of Substance Change in Illicit Drug Use by 8tth, 10th, and 12th Graders Since 2001 Percent Reporting Past Month Use
Admissions by Location - Age 12 and Older As recent findings from the National Survey on Drug Use and Health (NSDUH) show, substance abuse varies across States. Admissions to substance abuse treatment also demonstrate geographic differences, and admissions for various substances of abuse show specific geographic concentrations and patterns. These patterns also change over time.Admissions to substance abuse treatment by State can be monitored with the Treatment Episode Data Set (TEDS), an annual compilation of data on the demographic characteristics and substance abuse problems of those admitted to substance abuse treatment, primarily at facilities that receive some public funding. TEDS records represent admissions rather than individuals, as a person may be admitted to treatment more than once during a single year.Among the six primary substances of abuse that dominate TEDS admissions, the rates of substance abuse treatment admissions in the Nation as a whole increased for three (marijuana, methamphetamine/amphetamine, and opiates other than heroin) and decreased for three (alcohol, cocaine, and heroin). This report focuses on trends in admission rates for methamphetamine/ amphetamine and marijuana, which have the largest number of admissions among the substances with increased admission rates and, therefore, have the greatest impact on the treatment system.
Admissions - Comparison Between 1995 and 2005 Methamphetamine / Amphetamine
Admissions - Comparison Between 1995 and 2005 Methamphetamine / Amphetamine Source: 2005 SAHSA Treatment Episode Data Set (TEDS).
Admissions - Comparison Between 1995 and 2005 Marijuana Source: 2005 SAHSA Treatment Episode Data Set (TEDS).
Descriptive Epidemiology - Time “Time” Can Mean “Week in the Month”
Actual Study of “Week of the Month” “… the Number of Deaths in the United States … (by) Week of the Month” Does week of the month make a difference?
Study Method Number of Deaths in the United States by Week of the Month
How Results are Presented Number of Deaths in the United States by Week of the Month Hidden Data
How Results are Presented Number of Deaths in the United States by Week of the Month
Results “Over the course of the average year, there were 4,320 more deaths in the first week of every month than in the last week of the preceding month.”
Boundary Effect “Over the course of the average year, there were 4,320 more deaths in the first week of every month than in the last week of the preceding month.” Boundary Effect
Hypotheses Generation “Over the course of the average year, there were 4,320 more deaths in the first week of every month than in the last week of the preceding month.” Boundary Effect What hypotheses might explain this distribution?
Hypotheses • New Medical Personnel • “Hanging On” • Federal Benefits
New Medical Personnel? • New Medical Personnel • “Hanging On” • Federal Benefits
New Medical Personnel New Medical Personnel? Why? What hypotheses might explain this distribution? “If so, the boundary effect would be smaller for people who were dead on arrival at the medical facility than for those who died while hospitalized.”
New Medical Personnel New Medical Personnel? “In fact, … the boundary effect was larger for those who were dead on arrival than for those who died while hospitalized.”
Hanging On? • New Medical Personnel • “Hanging On” • Federal Benefits
“Hanging On” Hanging On? Why? What hypotheses might explain this distribution? “… some persons who might otherwise have died at the end of the month ‘held on’ until the beginning of the next month so that their families would receive one last Social security check.”
Federal Benefits? • New Medical Personnel • “Hanging On” • Federal Benefits
Federal Benefits Federal Benefits? Why? What hypotheses might explain this distribution? What causes of death would be related to receiving money (federal benefits)?
Federal Benefits Federal Benefits? Why? What hypotheses might explain this distribution? What causes of death would be related to receiving money (federal benefits)?
A List of Causes of Death • Complications of pregnancy/childbirth • Congenital anomalies • Disorders of blood or blood-forming organs • Disorders of musculoskeletal system or connective tissue • Disorders of nervous system • Genitourinary disorders • Infectious and parasitic diseases • Mental disorders, excluding substance abuse • Motor vehicle accidents • Liver disease with mention of alcohol • Liver disease without mention of alcohol • Neoplasms (tumors - cancer and non-cancer) • Respiratory disorders • Circulatory disorders • Substance abuse • Suicide
Calculating the Boundary Effect Boundary Effect # of Deaths in 1st Week X 100 # of Deaths in Last Week
Significant Boundary Effect? Hidden Causes of Death What causes of death would be related to receiving money (federal benefits)?
No Significant Boundary Effect? Hidden Causes of Death What causes of death would not be related to receiving money (federal benefits)?
Study Abstract AN INCREASE IN THE NUMBER OF DEATHS IN THE UNITED STATES IN THE FIRST WEEK OF THE MONTH An Association with Substance Abuse and Other Causes of Death David P. Phillips, PhD, Nicholas Christenfeld, PhD, Natalie M. Ryan, B.A. (New England Journal of Medicine 1999;341_93-8) ABSTRACT Background and Methods . . . Previous research has shown that among persons with schizophrenia, the rates of cocaine use and hospital admissions increase at the beginning of the month, after receipt of disability payments. . . Using computerized data from all death certificates in the US between 1973 and 1988, we compared the number of deaths in the first week of the month with the number of deaths in the last week of the preceding month. Results: . . . Between 1983 and 1988, for deaths involving substance abuse and an external cause (such as suicides, accidents and homicides, there were 114.2 deaths . . in the first week of the month for every 100 in the last week of the preceding month . . . Conclusions . . . In the United States, the number of deaths is higher in the first week of the month than in the last week of the preceding month. The increase at the beginning of the month is associated with substance abuse and other causes of death.
Re-Cap • Big Ideas in this Lesson (2-5) • “Time” information can generate hypotheses • Cyclical time trends in drug use over the past 30 years suggest hypotheses about time-related fluctuations in attitudes about drug use, extent of active prevention programs, and types of illicit substances that are available. • Some causes of death are more common in the first week of the month; this suggests hypotheses about relationships between death and availability of money to purchase illicit substances. This project is supported by a Science Education Drug Abuse Partnership Award, Grant Number 1R24DA016357-01, from the National Institute on Drug Abuse, National Institutes of Health.
Next Lesson Descriptive Epidemiology Generates hypotheses Analytical Epidemiology Tests hypotheses Hypothesis about associations