Download
1 / 155
1.64k likes | 2.14k Views
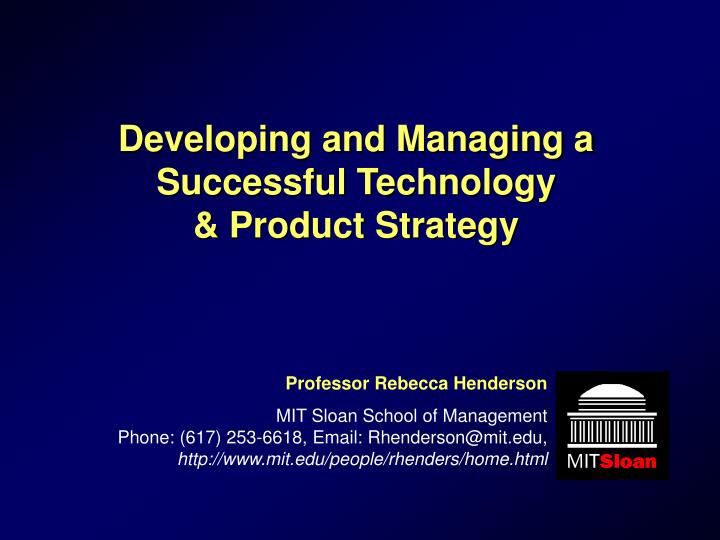
Developing and Managing a Successful Technology & Product Strategy . Professor Rebecca Henderson MIT Sloan School of Management Phone: (617) 253-6618, Email: Rhenderson@mit.edu, http://www.mit.edu/people/rhenders/home.html. Who are you, and why did you come?. Who am I?.

E N D
Developing and Managing a Successful Technology & Product Strategy Professor Rebecca Henderson MIT Sloan School of Management Phone: (617) 253-6618, Email: Rhenderson@mit.edu,http://www.mit.edu/people/rhenders/home.html
Who am I? • Eastman Kodak LFM Professor, MIT Sloan School • SB in Mechanical Engineering, MIT • PhD in Business Economics, Harvard • Research focus: Building on technology to generate growth: why is it so hard and what can be done? • Work in: Semiconductor capital equipment, Aerospace, Automotive, Branded Consumer Goods Pharmaceuticals & Biotech, IT, Telecommunications
Effective strategies answer three key questions: How will we Create value? How will we Capture value? How will we Deliver value?
How will we create value? • How will the technology evolve? • How will the market change? • How will we capture value? • How should we design the business model? • Where should we compete in the value chain? • How should we compete if standards are important? • How will we deliver value? • How do we manage the core business and growth simultaneously? • How do we use our strategy to drive real resource allocation?
Outline: • Why do I need an innovation strategy? • How will we create value? • How will we capture value? • How will we deliver value? • Doing strategy in practice
Resources Required for Completion (months) Implied Development Resource Allocation (months) Active Projects Months to Completion (desired) (formal development projects by number) This year Next year Year after that 1 2 3 4 5 . . . 26 27 28 29 30 54 123 86 286 24 352 75 215 153 29 8 24 12 20 4 36 9 30 18 3 40 38 50 92 24 48 62 40 60 29 14 62 36 172 0 150 13 80 93 0 0 23 0 22 0 120 0 95 0 0 All Other Support Activity –– –– 430 430 430 (customer support, troubleshooting) Total Development Requirements –– –– 2783 2956 2178 Available Resources (months) –– –– 960 960 960 Rate of Utilization (percent) –– –– 289.9 307.9 226.9 Overload at PreQuip
Overcommitment destroys productivity Average Value-Added Time on Engineering Tasks 100% 80% 60% 40% 20% 0% 1 2 3 4 5 6 Number of Projects per Engineer
ACTUAL MANAGEMENT ACTIVITY PROFILE The Timing and Impact of Management Attention Phases Knowledge Concept Basic Prototype Pilot Manufacturing Acquisition Investigation Design Building Production Ramp-Up High ABILITY TO INFLUENCE OUTCOME Index of Attention and Influence Low
Why is it so hard to kill project #26? • It’s a “good” project! • Good managers can meet stretch goals (and I’m a good manager) • Making difficult decisions takes time & energy It’s very hard to kill projects without a strategy
A Key Framework: The industry life cycle Era of Ferment/ Discontinuity Maturity “Dominant design” emerges Incremental Innovation
The Industry Life Cycle as an S curve Performance Maturity Discontinuity Takeoff Ferment Time
The S-curve Maps Major Transitions Maturity Performance Discontinuity Takeoff Ferment Time
But they also create major opportunity • Corning glass • Cookware to optical fiber • HP • Instrumentation to computers • IBM • Mainframes to PCs to Services • Eli Lilly • “Random” drug discovery to genetics and genomics
Discontinuities are hard! • Answers to the key strategic questions: • How do we create value? • How do we capture value? • How do we deliver value? • CHANGE!
Course Outline: • First Day: • How will we create value? • How will the technology evolve? • How will the market change? • How will we capture value? • How should we design the business model? • Where should we compete in the value chain? • How should we compete if standards are important? • Second Day: • How should we deliver value? • How do we manage the core business and real growth simultaneously? • How do we use our strategy to drive real resource allocation?
The first of 3 key questions How will we Create value? How will we Capture value? How will we Deliver value?
Creating Value: • Understand how technologies will evolve • (Both your own and those on which you rely) • Understand how customer needs will evolve • Develop world class products and services that meet customer needs
Agenda • Predicting Technological Change • The Delphi Model • Trend extrapolation • Predicting the Evolution of Customer Needs • Basic segmentation • Crossing the chasm • New technologies, new needs
Can one forecast the path of technological change? • No But • Delphi models • Forecasting by analogy • Trend extrapolation
Delphi Models • Ask the experts! • A committee? • Structured questionnaires? • Pros • Field experts are often years ahead of day to day practice: technologies do not “come from no where” • Cons • They sometimes have little knowledge of possible applications • They can be enthusiastic
Forecasting by Analogy The Internet will be like: Personalized medicine will be like: The Xbox will be like:
Forecasting by Analogy • Is nanotechnology like semiconductors? • Or like biotechnology? • Or like something else altogether?
m 10-10 10-9 10-8 10-7 10-6 10-5 10-4 10-3 10-2 red blood cell ~5 m (SEM) diatom 30 m Dimensions in Silicon and in Biology DNA proteins nm Simple molecules <1nm bacteria 1 m SOI transistor width 0.12m semiconductor nanocrystal (CdSe) 5nm Circuit design Copper wiring width 0.2m Nanometer memory element (Lieber) 1012 bits/cm2 (1Tbit/cm2) IBM PowerPC 750TM Microprocessor 7.56mm×8.799mm 6.35×10⁶ transistors • control biological machines
Trend analysis • The future is often much like the past, only more so
Issues in Trend Extrapolation • Which parameter shall I predict? • Do all good things come to an end? • Exploring the difference between progress as a result of the passage of time, and progress as the result of returns to effort • Predicting progress in complementary technologies
Do all good things come to an end?Technological exhaustion Physical limit? Performance Performance is ultimately constrained by physical limits E.g.: Sailing ships & the power of the wind Copper wire & transmission capability Semiconductors & the speed of the electron Time
Evolution of Measurement-While-Drilling tools S-Curve Physical limit: signal attenuation Continuous M.P. - FSK 3G Continuous M.P. - BPSK 3G Performance = Data Transmission Rate (bit per second) Continuous M.P. - 2G Shallow wells only All well conditions Continuous M.P. - 1G Positive Mud Pulse 2nd Generation Negative Mud Pulse Positive Mud Pulse Dominant Design = Continuous Mud Pulse Telemetry R&D Effort (measured in Generations = +/- 3 years )
MediLux 48 pounds The Evolution of Palomar’s Products: Laser Based Skin Treatment E2000 Ruby Laser Material Product Price Cost Year EpiLaser™ $150K $80K 1996 E2000™ $130K $60K 1997 LightSheer™ $100K $40K 1998 SLP1000™ $65K $25K 2000 EsteLux™ $40K $ 4K 2001 MediLux™ $50K $ 4K 2003 NeoLux™ $30K $ 4K 2003 StarLux™ $80K $ 5K 2004 Lux Handpieces $10K $ 1K 2002-4 Home Devices ? ? ? LightSheer 400 pounds 120 Pounds
Moore’s Law at Work $1,000,000,000.00 10x reduction $100,000,000.00 every 7.5 years $10,000,000.00 $1,000,000.00 $100,000.00 10x reduction every 4.25 years $10,000.00 Dollars per MIP $1,000.00 $100.00 $10.00 $1.00 $0.10 $0.01 1959 1969 1979 1989 1999 2009 [Source: Hans P. Moravec 1998-2003]
Modeling the returns to effort vs. time Performance Performance may be a non linear function of effort expended: in mature industries more and more effort may lead to less and less progress, while progress in emerging industries may be “surprisingly” fast Effort
Reflections on the S Curve • Which unit of analysis? • Industry? Firm? Technology? Product? • Which dimension of performance? • Effort vs. time? • Can performance limits be predicted? The S curve is best viewed as a tool for triggering discussion, not as a “scientific reality”
The Evolution of MarketsorPredicting the pattern of customer needs
Market Evolution over the Life Cycle • Market segmentation • Crossing the chasm • New markets, new needs: • The Innovator’s Dilemma
The Key Question:Who buys a technology as it evolves? Performance Time