Download
1 / 17
170 likes | 176 Views
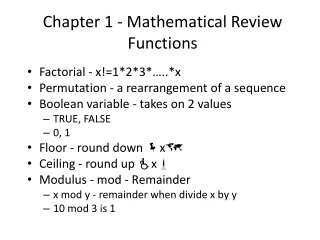
Chapter 1 Linear Functions and Mathematical Modeling Section 1.1. Section 1.1 Linear Equations and Intercepts. Intercepts General Form of a Linear Equation Graphing Lines Using the Intercepts Interpreting Intercepts in Different Contexts.

E N D
Chapter 1 Linear Functions and Mathematical ModelingSection 1.1
Section 1.1Linear Equations and Intercepts • Intercepts • General Form of a Linear Equation • Graphing Lines Using the Intercepts • Interpreting Intercepts in Different Contexts
The graph of a linear equation is a straight line. The x-intercept of the graph of a line is the point where the line crosses the x-axis The y-intercept of the graph of a line is the point where the line crosses the y-axis.
The general (or standard) form of a linear equation is denoted by ax + by = c, where a, b, and c are real numbers, a and b cannot both be 0. These are examples of linear equations: –4x + 2y = –6.2 y = 3.7x – 5 y = –3 These are not linear equations: x2 + y2 = 9
Find the x-and-y-intercepts of the linear equation –3x + ¾ y = 18. To find the x-intercept, set y = 0 and solve for x. –3x + ¾ (0) = 18 –3x = 18 x = –6 or the ordered pair (–6, 0) To find the y-intercept, set x = 0 and solve for y. –3(0) + ¾ y = 18 ¾ y = 18 (4/3)(¾) y = 18(4/3) y = 24 or the ordered pair (0, 24)
Graphing a Line Method 1: Using a table of values Create a table of values, plot the ordered pairs, and connect the points with a straight line.
Graph the equation –2x + y = 6 by using a table of values. Pick a set of x-values, substitute them (one at a time) into the equation to find the corresponding y-value. x = –1 –2(–1) + y = 6 2 + y = 6 2 – 2 + y = 6 – 2 y = 4 Plug this value into the table and repeat this process for x = 0 and x = 2. Plot the ordered pairs, and connect the points with a straight line.
Graphing a Line Method 2: Using the intercepts Find the x-intercept, find the y-intercept, plot the intercepts, and connect the points with a straight line.
Use the intercepts to graph 3x + 4y = 24. x-intercept: 3x + 4(0) = 24 3x = 24 x = 8 x-intercept is (8, 0) y-intercept: 3(0) + 4y= 24 4y = 24 y = 6 y-intercept is (0, 6) Now plot the intercepts, and connect the points with a straight line.
Maria needs to purchase graphing calculators and engineering paper for her students. She has $3225 in her budget. The calculators cost $129 each, and the packages of engineering paper cost $15 each. The equation 129x + 15y = 3225 represents Maria's purchases. Find and interpret both intercepts. x-intercept: 129x + 15(0) = 3225 x = 25 Maria can buy 25 calculators and no engineering paper for $3225. y-intercept: 129(0) + 15y = 3225 y = 215 Maria can buy 215 packages of engineering papers and no calculators for $3225.
Special Note The x-intercept is also known as the horizontalintercept. The y-intercept is also known as the verticalintercept.
Interpreting Horizontal and Vertical Intercepts from a Graph To help you interpret the intercepts, first determine what is represented by the horizontal axis and the vertical axis.
After a tropical storm, Jerry’s air boat was flooded with 40 gallons of water and he had to remove the water with his onboard sump pump. The graph below depicts the amount of water G (in gallons), left in the boat after t minutes of using the sump pump. Use the graph to find and interpret both intercepts in the context of the problem. The horizontal axis, t, represents: Time in minutes The vertical axis, G, represents: Gallons of Water The horizontal intercept is (25, 0). The sump pump will remove the water from the boat after 25 minutes. The vertical intercept is (0, 40). Before the sump pump was used, there were 40 gallons of water in the boat.
Writing equations from application problems Luigi has $84 to spend in apps for his iPad. He wants to buy action and sports games apps. The action games he likes cost $10.50 each and the sports games cost $7 each. Let x represent number of action games apps and y represent number of sport games apps. a. Write an equation that describes what Luigi can purchase with his money. “Action games at 10.50 each + Sports games at 7 each = 84” 10.50x + 7y = 84 b. If Luigi only purchases action games apps, how many can he buy? Since no sports games apps are bought, then y = 0. 10.50x + 7(0) = 84 x = 8 Luigi can buy 8 action games apps.
(Contd.) c. If Luigi only purchases sports games apps, how many can he buy? Our equation was: 10.50x + 7y = 84 Since no action games apps are bought, then x = 0. 10.50(0) + 7y = 84 y = 12 Luigi can buy 12 sports games apps. d. Sketch the graph of the linear equation using your answers from parts (b) and (c). Using the x-intercept, (8, 0), and the y-intercept, (0, 12), we can graph the linear equation:
Viewing Window Notation for Graphing Calculator • [Xmin, Xmax, Xscl] by [Ymin,Ymax,Yscl] • Given that a line has intercepts (–30, 0) and (0, 125), which of the • following viewing windows will be the most appropriate? • a. [–35, 10, 5] by [–30, 120, 20] • b. [–50, 40, 10] by [–40, 140, 20] • We are looking for a viewing window that will show both intercepts. • Only “b” will display both (–30, 0) and (0, 125). • Option “a” will not show the y-intercept, since the Y-max is 120.
Using your textbook, practice the problems assigned by your instructor to review the concepts from Section 1.1.