Download
1 / 54
540 likes | 550 Views
Basic Economic Concepts: Micro, Macro, PPC and Comparative Advantage. Mr. Bordelon University High School AP Economics. What is Economics?. Economics. Social science concerned with the efficient use of limited or scarce resources to achieve maximum satisfaction of human economic wants.

E N D
Basic Economic Concepts:Micro, Macro, PPC andComparative Advantage Mr. Bordelon University High School AP Economics
What is Economics? • Economics. Social science concerned with the efficient use of limited or scarce resources to achieve maximum satisfaction of human economic wants. • Scarcity and choice—these are your economic friends. • Every economic issue involves individual choice. • Why do we have to choose?
Market and Command Economies • Market Economy. Production and consumption are the result of decentralized decisions by many firms and individuals. • Command Economy. Industry is publicly owned and there is a central authority making production and consumption decisions. • Most countries have adopted a market economy. Command economies typically and spectacularly fail miserably. Why?
Market and Command Economies • Why do command economies fail? • 1. Incentives. Prices make for a powerful incentive. • Stupid question: why? • 2. Property rights. In command economies, the government owns all resources and property. • How is this a problem?
Factors of Production • Land • Labor • Capital • Physical capital • Human capital • Entrepreneurship
Scarcity • Economic resources are limited/scarce, which means that goods/services produced must be limited. • Scarcity requires choices to be made. • Choices require that something must be given up.
Opportunity Cost • Opportunity cost. The opportunity cost is the best alternative given up as a result of a decision. The sacrifice you make when you make a choice. • When you make a choice, you are giving up the opportunity to do something else.
Opportunity Cost • Awesome. What about free stuff? Is it actually free?
Opportunity Cost • No. Think of this in terms of resources, not marketing tactics. • Resources were used to make these “free” items (land, labor, capital) and because those resources do not have alternative uses, society gives up something else to produce the “free” items you get at no cost.
Opportunity Cost andMarginal Analysis • Opportunity Cost. The real cost of something is what you must give up to get it. • Decisions are often made on an incremental basis. Bit by bit, step by step. • Video games vs. studying.
Opportunity Cost andMarginal Analysis • Marginal Analysis. If the person believes that the additional benefits received from an activity outweigh the additional costs incurred, then the person will continue with that activity. • Marginal Benefits. The additional benefits. • Marginal Costs. The additional costs. • If MB ≥ MC, do it. If MB < MC, do not.
Micro- and Macroeconomics • Microeconomics. The branch of economics concerned with how individuals make decisions and how these decisions interact. Microeconomics focuses on choices made by individuals, households, or firms. • Macroeconomics. The branch of economics that sutdies the overall ups and down of the economy. Macro focuses on economic aggregates that summarize data across many different localized markets.
Positive and Normative Economics • Positive Economics. Economic analysis used to answer questions about how the world actually works. • Normative economics. Economic analysis that involves saying how the world should work.
Macroeconomics • Macroeconomics. The branch of economics that sutdies the overall ups and down of the economy. Macro focuses on economic aggregates that summarize data across many different localized markets.
Business Cycle • Business Cycle. Alternation between economic downturns and upturns in the macroeconomy. • Peak. Business activity reaches temporary maximum with full employment and near capacity output. Unemployment rate at lowest level. • Recession. Decline in total output, income, employment, and trade lasting six months or more. Unemployment rate rising. • Trough. Bottom of recession period. Unemployment at highest level. • Recovery. Output and employment expanding toward full-employment. Unemployment rate falling. • Cycle measured by time between peaks in the cycle.
Employment, Unemployment, Business Cycle • Measured by Bureau of Labor Statistics. • Under 16 or institutionalized (military/jail) not surveyed. • Labor force = employed + unemployed • Those not in labor force.
Employed and Unemployed • Employed: those who work at a job with pay for at least one hour or without pay for at least 15 hours (family business/farm). • Unemployed: no job, or temporarily laid off but actively looking for work.
Labor Force and Unemployment Rate • LF = E + U • UR% = 100 x (#U)/(#LF) • Unemployment Rate. Percentage of labor force not employed.
Aggregate Output andthe Business Cycle • Aggregate Output. Economy’s total production of g/s for a given time period, usually a year. • Relation to Unemployment • Economy is strong, many g/s produced, firms need to hire workers, employment is high, unemployment rate is low. • Economy is weak, fewer g/s produced firms need to lay off workers, employment low, unemployment rate is high.
Inflation, Deflation,and Price Stability • Inflation. A rise in the overall price level. • Reduces ability to purchase g/s. • Deflation. A fall in the overall price level. • As prices fall, consumers hold onto money and wait for lower and lower prices. • Why could this be a problem?
Ceteris Paribus • Ceteris Paribus. In order to figure out the effect one variable has on another, we have to hold other contributing factors constant. This is the idea of ceteris paribus, or “other things equal.”
Production Possibilies Curve • Efficient in production. All points along the curve are efficient in production. Can not increase production of one without giving up production of the other. • Efficient in allocation. What society wishes to have more than anything else. If society wants more of one thing than another, that point in the PPC would be efficient in production but not allocation.
Production Possibilities Curve • Opportunity cost. What is the opportunity cost between pizza and bulldozers? • Opportunity cost of the good graphed on x-axis is ALWAYS slope of PPC. • Opportunity cost of the good graphed on y-axis is ALWAYS the inverse of the slope of PPC. • Does it matter where you start out on the PPC in determining the opportunity cost? • The opportunity cost (slope) is constant. What does this tell you about the substitutability of the resources used to produce pizza and bulldozers?
Law ofIncreasing Opportunity Costs • When switching from one item of production to another, more and more resources are necessary to incrase production of the second item. • 1. Amount of other products forgone to obtain more of any given product is the opportunity cost. • 2. More of a product produced, greater is its (marginal) opportunity cost. • 3. Slope of PPC becomes steeper, demonstrating increasing opportunity cost (which gives curve its concave look).
Law ofIncreasing Opportunity Costs • Why? • Economic resources are not completely adaptable to alternative uses. • To get increasing amounts of bulldozers, resources that are not particularly well suited for that purpose must be used. Workers accustomed to producing pizza may not be good bulldozer builders. Gee, go figure. • Pizza ovens are physical capital, and not very adaptable to building bulldozers.
Economic Growth • Economic growth means an expansion of the economy’s production possibilities. The economy can produce more of everything.
Summary PPC • Efficiency. PPC represents combinations of output that are possible, given economy’s resources and tech. • Scarcity. Given stock of resources and tech, economy can produce only so much. • Economic Growth. Rightward shift or rotation of PPC. • Choice.
Comparative Advantage and Trade • Why do we trade? • How do you think this might affect the PPC?
Comparative Advantage and Trade • Milton Hershey is famous for making chocolate. • And going bankrupt twice. • What does it take to make chocolate? • Land • Labor • Capital
Comparative Advantage and Trade • How much chocolate do you think Hershey personally produced?
Comparative Advantage and Trade • Reality is if Hershey got his hands dirty at all, it was with filthy stacks of obscene amounts of cash. • Why hire all these people to work for him creating chocolate?
Comparative Advantage and Trade • Specialization. Each person specializes in the task that he or she is good at performing. • Gains from trade. By diving tasks up and trading, people can each get more of what they want than they could get by being self-sufficient. • Key: The economy can produce more when each person specializes in a task and trades with others.
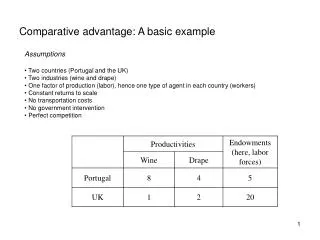
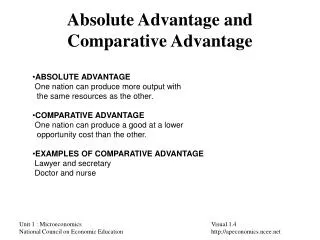
Comparative Advantage • Comparative Advantage. Individual has comparative advantage in producing something if hte opportunity cost of that production is lower for that individual than for other people. • Basic Idea: There are differing opportunity costs of producing various g/s. Trading partners benefit if they specialize and trade based upon comparative advantage. There are gains from trade even if one of traders isn’t particularly specialized.
Reading the PPC • According to PPC, Tom can catch 40 fish, but only if no coconuts. He could get 30 coconuts, but only if no fish. • What’s the slope?
Reading the PPC: Tom • According to PPC, Tom can catch 40 fish, but only if no coconuts. He could get 30 coconuts, but only if no fish. • What’s the slope? -3/4 • Opportunity cost of 1 fish is ¾ of a coconut. • What’s the opportunity cost of 1 coconut to fish?
Reading the PPC: Hank • Hank’s PPC has a slope of -2. • Opportunity cost of 1 fish is 2 coconuts. • What’s the opportunity cost of 1 coconut to fish?
Gains from Trade • Tom and Hank are better off when they specialize in what they are good at and trade for each other. • Tom should catch fish. Why? • Hank should get coconuts. Why?
Here’s the Deal • Tom gives 10 fish to Hank. • Tom consumes two more fish per week and one more coconut per week. • Hank gives 10 coconuts to Tom. • Hank consumes four more fish per week and two more coconuts per week.
Limits on Trade • Why did Tom and Hank agree to a deal of 10 fish for 10 coconuts? Was there another deal to be made? • Hank will not accept a deal where he must give up more than 2 coconuts per fish. • Tom will not accept a deal where he must give up more than 4/3 of a fish per coconut. • Why?