Download
1 / 31
310 likes | 400 Views
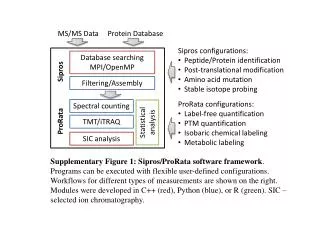
Suruchi Rao Harini Chandra. MS Data analysis for Proteomics studies.

E N D
Suruchi Rao Harini Chandra MS Data analysis for Proteomics studies The process of inferring accurate protein identification data from thousands of mass spectra generated in mass spectrometry based proteomics experiments is a complicated and challenging process. Improved computation and greater data storage capability developed over the last decade has now considerably simplified this process.
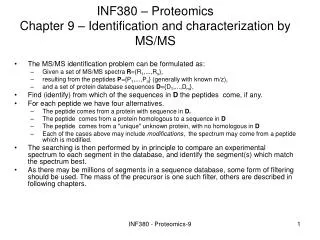
Master Layout (Part 1) 1 This animation consists of 3 parts: Part 1 – Typical proteomics experiment Part 2 – Peptide Mass Fingerprinting (PMF) Part 3 – MS/MS Data analysis SDS-PAGE 2-DE 2 + + + + + + Proteolysis (trypsin digestion) + 3 Tandem MS/MS MALDI 4 Mass spectra 5
Definitions of the components:Part 1 – Typical proteomics experiment 1 1. Typical Proteomics Experiment: One that involves the use of a Mass Spectrometer to analyze the content of a proteome or to elucidate individual components of a protein complex after they have been suitably separated by various gel-based or chromatographic techniques. 2. SDS-PAGE: SDS-PAGE is a separation technique that brings about protein separation under denaturing conditions. This is extensively used along with quantitative proteomics techniques like iTRAQ, SILAC etc. Once the proteins have been separated, the gel can be cut into pieces and the desired bands can be eluted out, which can then be taken for further identification by MS. 3. 2-DE: The commonly used protein separation technique that carries out fractionation of the protein mixture based on isoelectric point in one dimension and molecular weight in the second dimension. Protein bands from the gel can be excised and eluted using a suitable buffer and used for further analysis by MS. 4. Proteolysis: The process of site-specific digestion of proteins, typically by the proteolytic enzyme, Trypsin, which generates peptide fragments of appropriate size that are analyzed in the form of positive ions in MS. 2 3 4 5
Definitions of the components:Part 1 – Typical proteomics experiment 1 5. Tandem MS/MS:This is a MS technique that makes use of a combination of ion source and two mass analyzers, separated by a collision cell, in order to provide improved resolution of the fragment ions. The mass analyzers may either be the same or different. The first mass analyzer selects only a particular ion which is further fragmented and resolved in the second analyzer. This can be used for protein sequencing studies. 6. Matrix Assisted Laser Desorption Ionization (MALDI): MALDI is an efficient process for generating gas-phase ion of peptides and proteins for mass spectrometric detection. Target platewith dried matrix-proteinsample is exposed to short, intense pulses from a UV laser. 7. Mass spectra: Charged peptide fragments are resolved by the mass analyzer on the basis of their mass-to-charge ratios and then detected by means of the detector, which generates a spectrum of relative abundances of the ions against their mass-to-charge ratio. 2 3 4 5
Part 1, Step 1 1 Proteolytic digestion 2 SDS-PAGE 2-DE Trypsin 3 Peptide fragments Protein of interest Tube containing trypsin & buffer 4 Description of the action Audio Narration Action Most proteomics experiments involve the separation of a protein mixture by means of electrophoresis followed by elution of the protein band of interest. This protein is then digested into small peptide fragments by means of proteolytic enzymes, the most commonly used one being trypsin. These small peptide fragments can then be further analyzed by MS First show the two squares on top with the black patterns on them. Then show the red circle followed by the tube below & the two arrows. The black dots in the circle must enter the tube. This must then be zoomed into and the violet shape in the box must be shown. The green object must then appear which must move along the violet shape breaking it up into small fragments (shown on the right) as it moves. As shown in animation. 5
Part 1, Step 2 1 Mass Spectrometry analysis – MALDI TOF Spectra of analyte protein Tryptic digest 2 Laser source Applied to sample plate Detector + + + + + + + 3 + + + + + + TOF tube MALDI Sample plate 4 Reflector Description of the action Audio Narration Action First show the tube marked ‘tryptic digest’ followed by the down arrow with label and the setup shown below that. Next show a light coming out of the red cylinder which must hit the white plate on the left and then move towards the white ‘reflector’ on the right end of the tube and finally must be deflected onto the detector. Next show the ions of different sizes appearing which must move at different speeds across the tube with the smallest ones moving the fastest and largest moving slowly. They must move until they reach the detector after which the graph above must be shown. The peptide fragments obtained after digestion can be analyzed either by MALDI-TOF or by Tandem MS/MS. In MALDI-TOF, peptide ions are accelerated at different velocities depending on their mass to charge ratios. The spectrum generated provides a set of peaks whose masses represent each of the peptides present in the mixture. These spectra can then be analyzed by various available softwares to obtain more information about the protein. As shown in animation. 5
Part 1, Step 3 1 Mass Spectrometry analysis – Tandem MS/MS Tryptic digest Detector 2 Spectra of analyte protein Peptide ions generated + Ions of selected m/z + + + + + 3 + Q2 – Collision cell Q3 – RF mode Peptide ions Q1 – Scanning mode Fragmented ions 4 Audio Narration Description of the action Action Tandem MS/MS is capable of providing more in-depth sequence information. Each peptide in the digest is further fragmented in the second ionization step and analyzed, thereby generating a spectrum for each peptide. These spectra can then be analyzed by various available softwares to obtain more information about the protein. First show the tube on top marked ‘tryptic digest’ followed by the down arrow with label followed by the coloured ions and the remaining components. The ions must move towards the first set of rods & only the pink ions must be allowed through the opening. These must enter the orange cube. In this, they must get fragmented into smaller pieces and must come out of the other end as shown. These smaller pieces must fly through the second set of rods and enter the detector. As each of the fragments reaches the detector, the graph on the right must start appearing from left to right until all the fragments have been detected. As shown in animation. 5
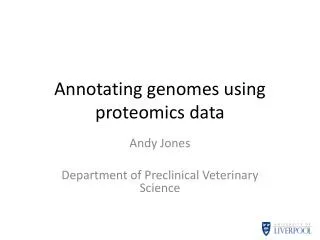
Master Layout (Part 2) 1 This animation consists of 3 parts: Part 1 – Typical proteomics experiment Part 2 – Peptide Mass Fingerprinting (PMF) Part 3 – MS/MS Data analysis Spectrum from MALDI analysis 2 Open shareware for PMF 3 Online search with sequence databases 4 Best fit – Score histogram 5 www.matrixscience.com
Definitions of the components:Part 2 – Peptide Mass Fingerprinting (PMF) 1 1. Peptide Mass Fingerprinting: This is one of the protein analysis methods which compares mass values of peptides generated from the protein analyte to a database of known proteins to arrive at its probable identity in the form of the “best fit”. 2. Spectrum from MALDI analysis: The peptide fragments generated after proteolytic digestion are analyzed by MALDI-TOF and the spectrum generated used for further analysis using online sequence databases. 3. Online search: Several open source databases are available online, which allow analysis of the MS spectrum generated. 4. Open shareware for PMF: These are database search algorithms used for comparing experimental masses against theoretically calculated peptide masses derived by applying “cleavage rules” to large primary sequence protein databases. The result of the comparison lists a number of proteins in the order of the best probable identity as derived by a probability score. The open shareware consists of the following fields which need to entered by the user: • Name and Email: Used for identification of search entry and also for e-mailing results page in case of loss of connection without requiring re-entry of data. • Search Title: Used to identify and label search entry and typically includes the name of the protein whose information is required. • Database/s: The primary sequence protein databases, including NCBInr and SwissProt against whom the query is run. A contaminants database is also recommended to eliminate contaminants such as keratin, trypsin and BSA. 2 3 4 5
Definitions of the components:Part 2 – Peptide Mass Fingerprinting (PMF) 1 • Taxonomy: It allows the search query to be limited to a particular species or a group of species bringing otherwise weaker hits to notice. • Enzyme: The proteolytic enzyme chosen during sample prep of analyte protein before its mass spectrometric analysis. Most popular of these is trypsin but if any other enzyme is used its site specificity is expected to be equal to or better than that of trypsin. • Missed Cleavage Allowed: Occurrence of partial digests during trypsinization of analyte protein at one or two Arginine and Lysine sites is a common phenomenon and needs to be accounted for during search against calculated peptide masses. • Modifications: During sample prep for Mass Spec Analysis of proteins, some changes in the mass of specific residues might occur, such as oxidation of methionine, carboxymethyl and cysteine etc. To account for these mass changes, the algorithm allows two types of modifications to be pre-selected- Fixed and Variable. • Fixed Modifications: Modifications that need to be applied collectively across the database to account for change in mass of specific residue/s. Most common fixed modification is the selection of the mass of carboxymethyl over cysteine replacing its mass as 161 Da. • Variable Modifications: These are mass changes suspected to occur during sample handling and accounted for by increasing the number of primary sequences compared against experimental masses. Most common variable modification is the oxidation of methionine residue in the analyte protein. • Protein Mass: Mass of intact protein in the form of a contiguous stretch including all matched peptides. If mass is unknown, this parameter can be left empty and the mass will remain unrestricted. 2 3 4 5
Definitions of the components:Part 2 – Peptide Mass Fingerprinting (PMF) 1 • Peptide Tolerance: This is a parameter associated with accuracy and resolution of the mass spectrometer and is used to account for shifts in isotope spacings. • Mass Values: To specify the type of charge of the analyte being examined by Peptide Mass Fingerprinting, i.e. MH+ , M-H- or if the masses correspond to neutral values like Mr . • Monoisotopic Mass Vs Average Mass Value: Depending upon the mass accuracy of a spectrometer, the experimental masses calculated for identification of analyte by Peptide mass fingerprinting is either chosen to be monoisotopic mass or the average mass of its isotopic elements. The selection of monoisotopic mass rests upon the ability of the instrument to resolve isotopes, and accurately determine peak mass. Average mass is the sum of abundance-weighted masses of all isotopes while the monoisotopic mass is the sum of masses of the most abundant isotope of each element. If the instrument has insufficient mass resolution capabilities combined with poor signal to noise ratio, the peptide mass of experimental values must be selected as being average to provide better identification. 5. Best fit – Score histogram: The “best fit” is defined as the primary identification of the analyte protein made by the database search algorithm representing either the exact protein being analyzed or the protein with the closest primary sequence homology, unusually with equivalent function in a related species. The score histogram depicts the distribution of protein scores for all the hits obtained by the query. 2 3 4 5
Part 2, Step 1 1 Data input proteomics@gmail.com Your name Email Proteomics Search title Serum albumin Enzyme Database(s) SwissProt NCBInr MSDB Trypsin Trypsin Chymotrypsin Peptidase 2 Taxonomy Mammalian Mammalian Bacterial Plant Fixed modifications Carbamoylation Alkylation 3 Variable modification Oxidation (M) 0.2 Da Protein mass Peptide tol. kDa 66 Monoisotopic Mass value M M-H- Average MH+ Data file Choose file Start search… 4 Description of the action Audio Narration Action There are many MS analysis softwares available online that allow data generated from MS to be analyzed. They require inputs from the user regarding the experimental parameters used such as enzyme cleavage, protein name, fixed modifications etc. and the desired search criteria like taxonomy, peptide tolerance, taxonomy etc. Commonly used protein databases against which the MS information is processed to retrieve sequence data include NCBI, MSDB and SwissProt. The data file generated from MS is uploaded and the search carried out. We will demonstrate data analysis using Mascot (www.matrixscience.com). As shown in animaion. First show the computer with the screen having a form on the inside. This must be zoomed into and the form above must be displayed. Each of the fields must be filled in as shown with some requiring selection using the white mouse pointer as depicted. 5 Source: http://www.matrixscience.com
Part 2, Step 2 1 Data output Mascot Search Results User: Proteomics Email: proteomics@gmail.com Search title: Transcription factor Database: SwissProt Time stamp: 2 June 2010 at 17:45:35 GMT Top score: 192 for PML_mouse, probable transcription factor 2 Mascot Score Histogram >5% Random match 3 <5% Random match 4 Description of the action Audio Narration Action The final results of the search are depicted in a concise report, beginning with a Protein Score Histogram. The protein score is a measure of the statistical significance of the protein hit. The histogram seen here displays the distribution of protein scores . Random matches made during database comparison are generally found in the green shaded region where the probability of finding a random hit is greater than 5%. The single red peak at the end of the histogram is the protein that has less than5% chance of being a random hit, making it a statistically significant identity of the unknown protein analyte. As shown in animaion. First show the computer with the screen displaying the search results. This must be zoomed into to clearly depict the report as shown. The arrows with the red text boxes must then appear. 5 www.matrixscience.com
Part 2, Step 3 1 Data output Concise Protein Summary Report 2 1. PML_MOUSE Mass: 97455 Score: 192 Expect: 1e-14 Matches: 15 Probable transcription factor PML for mouse MURC_IDILO Mass: 52994 Score: 51 Expect: 2 Matches: 5 UDP-N-acetylmuramate--L-alanine ligase (EC 6.3.2.8) (UDP-N-acetylmuramoyl-L-alanine synthetase) - I DPO1_RICHE Mass: 104386 Score: 50 Expect: 2.8 Matches: 6 DNA polymerase I (EC 2.7.7.7) (POL I) - Rickettsia helvetica THIO_PONPY Mass: 11877 Score: 41 Expect: 20 Matches: 3 Thioredoxin (Trx) - Pongo pygmaeus (Orangutan) RBL2_RHOS4 Mass: 50569 Score: 40 Expect: 28 Matches: 4 Ribulose bisphosphate carboxylase (EC 4.1.1.39) (RuBisCO) - Rhodobacter sphaeroides (strain ATCC 17 RBL2_RHOSH Mass: 50487 Score: 40 Expect: 28 Matches: 4 Ribulose bisphosphate carboxylase (EC 4.1.1.39) (RuBisCO) - Rhodobacter sphaeroides (Rhodopseudomon GPA1_YEAST Mass: 54042 Score: 40 Expect: 29 Matches: 4 Guanine nucleotide-binding protein alpha-1 subunit (GP1-alpha) - Saccharomyces cerevisiae (Baker's BNA4_YEAST Mass: 52396 Score: 39 Expect: 36 Matches: 4 Kynurenine 3-monooxygenase (EC 1.14.13.9) (Kynurenine 3-hydroxylase) (Biosynthesis of nicotinic aci SWR1_DEBHA Mass: 184594 Score: 38 Expect: 45 Matches: 6 Helicase SWR1 (EC 3.6.1.-) - Debaryomyces hansenii (Yeast) (Torulaspora hansenii) IFNW1_HUMAN Mass: 22304 Score: 36 Expect: 69 Matches: 3 Interferon omega-1 precursor (Interferon alpha-II-1) - Homo sapiens (Human) 3 Protein information 4 Description of the action Audio Narration Action First show the computer with the screen with the search results displayed on the screen. This must be zoomed into to clearly depict it. The green box must then appear and flash along with the arrow and label. The user must be allowed to click on this and is taken to the next slide. The Concise Summary report provides details of the peptide matches made by the algorithm which deduces the most probably protein match. The first hit is usually the “best fit” to the experimental masses that were entered in the search query. A protein score higher than 67 is considered to be a significant score. And a lower E value indicates that the probability of the hit being a random event is extremely low. Significant amount of information about the protein can be obtained from the report by clicking on the corresponding protein link. As shown in animaion. 5 www.matrixscience.com
The protein score is a sum of the highest ion scores for each sequence, with duplicate matches being excluded. Score above 67 is significant for this hit. Part 2, Step 4 (a) 1 Protein information – data analysis & interpretation Protein view Predicted mass of the protein. Predicted isoelectric point of the protein. Match to: PML_MOUSE Score: 192 Expect: 1e-14 Probable transcription factor PML Nominal mass (Mr): 97470; Calculated pI value: 5.88 NCBI BLAST search of PML_MOUSE against nr Unformatted sequence string for pasting into other applications Taxonomy: Mus musculus Cleavage by Trypsin: cuts C-term side of KR unless next residue is P Number of mass values searched: 18 Number of mass values matched: 15 Sequence Coverage: 22% Matched peptides shown in Bold Red 1 MEPAPARSPRPQQDPARPQE PTMPPPETPS EGRQPSPSPS PTERAPASEE 51 EFQFLRCQQC QAEAKCPKLL PCLHTLCSGC LEASGMQCPI CQAPWPLGAD 101 TPALDNVFFE SLQRRLSVYR QIVDAQAVCT RCKESADFWC FECEQLLCAK 151 CFEAHQWFLK HEARPLAELR NQSVREFLDG TRKTNNIFCS NPNHRTPTLT 201 SIYCRGCSKP LCCSCALLDS SHSELKCDIS AEIQQRQEEL DAMTQALQEQ 251 DSAFGAVHAQ MHAAVGQLGR ARAETEELIR ERVRQVVAHV RAQERELLEA 301 VDARYQRDYEEMASRLGRLDAVLQRIRTGS ALVQRMKCYA SDQEVLDMHG 351 FLRQALCRLRQEEPQSLQAA VRTDGFDEFK VRLQDLSSCI TQGKDAAVSK 401 KASPEAASTP RDPIDVDLPE EAERVKAQVQ ALGLAEAQPM AVVQSVPGAH 451 PVPVYAFSIK GPSYGEDVSN TTTAQKRKCS QTQCPRKVIK MESEEGKEAR 501 LARSSPEQPRPSTSKAVSPP HLDGPPSPRS PVIGSEVFLP NSNHVASGAG 551 EAEERVVVIS SSEDSDAENS SSRELDDSSS ESSDLQLEGP STLRVLDENL 601 ADPQAEDRPL VFFDLKIDNE TQKISQLAAV NRESKFRVVI QPEAFFSIYS 651 KAVSLEVGLQ HFLSFLSSMR RPILACYKLW GPGLPNFFRA LEDINRLWEF 701 QEAISGFLAA LPLIRERVPG ASSFKLKNLA QTYLARNMSE RSAMAAVLAM 751 RDLCRLLEVS PGPQLAQHVY PFSSLQCFAS LQPLVQAAVL PRAEARLLAL 801 HNVSFMELLS AHRRDRQGGL KKYSRYLSLQ TTTLPPAQPA FNLQALGTYF 851 EGLLEGPALA RAEGVSTPLA GRGLAERASQ QS Indicates the % of matching peptides. All peptides are displayed with matching peptides indicated in red. 2 3 4 Description of the action Audio Narration Action On selecting a particular protein link, the protein view provides details regarding the protein score, molecular weight, isoelectric point, the sequence coverage of the protein etc. The greater the percentage sequence coverage, more are the number of matching peptides for that particular protein. All sequences are displayed with the matching sequences being indicated in red. As shown in animaion. Show all the text output. Next show the green highlighted boxes one at a time with the corresponding dialogue box appearing for each of the highlighted regions. The results on the next slide must also be displayed along with this page. 5 www.matrixscience.com
Part 2, Step 4 (b) 1 Protein information – data analysis Protein view Observed molecular weight. 2 Indicates beginning & end of each peptide. Experimental molecular weight. Calculated molecular weight. Sequence of peptide fragment. Start - End Observed Mr(expt) Mr(calc) Delta Miss Sequence 8 - 33 2882.5000 2881.4927 2881.3777 0.1150 0 R.SPRPQQDPARPQEPTMPPPETPSEGR.Q 34 - 44 1182.4400 1181.4327 1181.5677 -0.1349 0 R.QPSPSPSPTER.A 45 - 56 1423.5200 1422.5127 1422.6779 -0.1652 0 R.APASEEEFQFLR.C 161 - 170 1191.5000 1190.4927 1190.6520 -0.1592 0 K.HEARPLAELR.N 308 - 315 1000.3300 999.3227 999.3967 -0.0740 0 R.DYEEMASR.L 319 - 325 814.4300 813.4227 813.4708 -0.0481 0 R.LDAVLQR.I 359 - 372 1624.7400 1623.7327 1623.8692 -0.1365 1 R.LRQEEPQSLQAAVR.T 361 - 372 1355.5300 1354.5227 1354.6841 -0.1613 0 R.QEEPQSLQAAVR.T 373 - 380 958.3500 957.3427 957.4080 -0.0653 0 R.TDGFDEFK.V 491 - 500 1165.3900 1164.3827 1164.5081 -0.1253 1 K.MESEEGKEAR.L 504 - 515 1300.4700 1299.4627 1299.6419 -0.1792 0 R.SSPEQPRPSTSK.A 516 - 529 1426.5700 1425.5627 1425.7365 -0.1737 0 K.AVSPPHLDGPPSPR.S 530 - 555 2653.3900 2652.3827 2652.2780 0.1048 0 R.SPVIGSEVFLPNSNHVASGAGEAEER.V 574 - 594 2265.1100 2264.1027 2264.0292 0.0735 0 R.ELDDSSSESSDLQLEGPSTLR.V 595 - 616 2544.4100 2543.4027 2543.2908 0.1120 0 R.VLDENLADPQAEDRPLVFFDLK.I 3 4 Description of the action Audio Narration Action Sequence of each peptide fragment processed in the database is displayed along with information regarding its molecular weight, starting and ending amino acid number and the number of missed cleavages during tryptic cleavage. All these data provides a comprehensive understanding of the protein being analyzed. As shown in animaion. Show all the text output. Next show the green highlighted boxes one at a time with the corresponding dialogue box appearing for each of the highlighted regions. The results on the next slide must also be displayed along with this page. 5 www.matrixscience.com
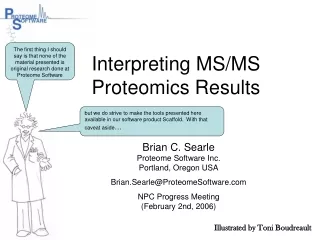
Master Layout (Part 3) 1 This animation consists of 3 parts: Part 1 – Typical proteomics experiment Part 2 – Peptide Mass Fingerprinting (PMF) Part 3 – MS/MS Data analysis Spectra from MS/MS analysis 2 Open shareware for MS/MS analysis 3 Online search with sequence databases 4 Peptide summary report 5 www.matrixscience.com
Definitions of the components:Part 3 – MS/MS data analysis 1 1. Tandem MS/MS analysis: This is another protein analysis method which compares the fragmentation spectra of the analyte protein. These fragmentation and parent masses, representative of the amino acid sequence of the analyte’s peptides are then compared to databases of known proteins to identify each peptide at a time and then infer protein identity by searching for the presence of particular peptides. 2. Spectrum from MS/MS analysis: MS/MS analysis generates fragmentation patterns for each peptide of the proteolytic digest. These are useful for determining the sequence of the protein analyte. 3. Online search: Several open source databases are available online, which allow analysis of the MS spectrum generated. 4. Open shareware for MS/MS analysis: This consists of a two step process involving; first, the identification of peptides by comparing sequenced peptides against theoretical databases of MS/MS Spectra generated from primary sequence databases and second, by collating these peptide identifications into a minimal protein list and scoring them to provide statistical validation. In addition to the same fields discussed for PMF, this shareware consists of the following additional fields which need to entered by the user: • Database/s: The databases available for MS/MS spectra comparison, include NCBInr Db, SwissProt Db apart from several EST databases if the initial search provides no positive Ids. Selecting a contaminants database is also recommended to eliminate contaminants such as keratin, trypsin and BSA. 2 3 4 5
Definitions of the components:Part 3 – MS/MS data analysis 1 Quantitation: It is a search parameter used to implement different search protocols which might have been used to quantify protein analyte by mass spectrometry. Some examples of the options available for setting a particular quantitation method include, iTRAQ 4plex, SILAC multiplex, ICAT D8 etc. Precursor Value: This parameter calls for the m/z value of the parent peptide in case the MS/MS data format does not automatically provide it. It is used, in conjunction with the charge of the parent peptide, to calculate its relative molecular weight (Mr). Peptide Charge: It is the parameter used to indicate the charge state of the precursor peptide, so that its Mr can be calculated from the observed m/z value. MS/MS Tolerance: It is associated with accuracy and resolution of the mass spectrometer and used to resolve isotope shifts in MS/MS fragmentation masses. Instrument: Informing the algorithm about the instrument used to carry out fragmentation studies helps especially when instead of just CID, either ETD or ECD has been used. Depending upon the instrument a particular ion stream is used to find a peptide match. Data Format: There are several data formats that are used to process MS/MS fragmentation data such as SCIEX API III, PerSeptive (.PKS) and Bruker (.XML) associated with software or instrument. Depending upon the search type, individual MS/MS spectrum or thousands of spectra from LC-MS/MS type search can be carried out. 2 3 4 5
Definitions of the components: Part 3 – MS/MS data analysis 1 • Error Tolerant Search: This parameter can be put to use in case, a large percent of the experimental MS/MS remains unidentified. By performing this type of search, it is possible to make adjustments to accommodate issues such as absence of peptide sequence in database, non-specificity of proteolytic enzyme used for protein digestion or even unknown post-translational modifications that cause fluctuations in the mass of analyte isomers. 5. Peptide summary report: The peptide summary report provides the most probable protein identity by individually identifying and grouping each of the peptides.The greater the number of peptides, the higher the protein score for the hit as it is derived from individual ion scores. Further statistical validations will help ascertain the find and improve the statistical health of the protein hit. 2 3 4 5
Part 3, Step 1 1 Data input proteomics@gmail.com Your name Email Proteomics Search title Sample protein Enzyme Database(s) SwissProt NCBInr MSDB Trypsin Trypsin Chymotrypsin Peptidase Quantitation 2 Taxonomy Bacterial Mammalia Bacterial Plant Fixed modifications Carboxymethyl (C) 3 Variable modification Oxidation (M) # C13 0.2 Da Peptide tol. MS/MS tol. Da 1.2 Monoisotopic Peptide charge Average Data file Choose file Data format Precursor 4 Instrument Start search… ESI-Q-TOF MALDI-TOF ESI-Q-TOF MALDI-TOF-TOF Description of the action Audio Narration Action The MS/MS data analysis shareware has some extra inputs such as Quantitation, MS/MS tolerance, peptide charge, instrument etc. in addition to the fields for PMF. They require inputs from the user regarding the experimental parameters used such as enzyme cleavage, protein name, modifications etc. and the desired search criteria like taxonomy, peptide tolerance etc. Commonly used protein databases against which the MS information is processed to retrieve sequence data include NCBI, MSDB and SwissProt. The data file generated from MS is uploaded and the search carried out. As shown in animaion. First show the computer with the screen having a form on the inside. This must be zoomed into and the form above must be displayed. Each of the fields must be filled in as shown with some requiring selection using the white mouse pointer as depicted. 5
Part 3, Step 2 1 Data output Mascot Search Results User: proteomics Email: proteomics@gmail.com Search title: Sample protein Database: NCBInr Taxonomy: Mammalia Time stamp: 2 June 2010 at 17:45:35 GMT Protein hits: 2 Mascot Score Histogram 3 >5% Random match <5% Random match 4 Description of the action Audio Narration Action As shown in animaion. The Tandem MS protein analysis is used to obtain protein identities from each of the sequenced peptides. The results page begins with a list of probable protein identities and their respective sources. The score histogram provides details similar to the PMF analysis, with the probability distribution being displayed graphically. The green shaded region is indicative of a match that has greater than 5% chance of being random while the red peak indicates that the chances of a random match is less than 5%. First show the computer with the screen displaying the search results. This must be zoomed into to clearly depict the report as shown. The red box must appear at the region indicated along with the blue arrow. 5 www.matrixscience.com
Part 3, Step 3 1 Data output Peptide summary report 2 1. gi|31753114 Mass: 30840 Score: 225 Matches: 8(3) Sequences: 3(2) Unknown (protein for IMAGE:5194336) [Homo sapiens] Check to include this hit in error tolerant search Query Observed Mr(expt) Mr(calc) ppm Miss Score Expect Rank Unique Peptide 4492.2200 982.4254 982.4913 -67.02 0 66 0.00036 1 U K.FGEAVWFK.A 5492.2305 982.4464 982.4913 -45.65 0 (40) 0.14 1 U K.FGEAVWFK.A 6492.2348 982.4551 982.4913 -36.79 0 (32) 0.82 1 U K.FGEAVWFK.A 39960.4446 1918.8746 1918.9797 -54.78 0 118 2.8e-09 1 U R.WAMLGALGCVFPELLAR.N + Oxidation (M) 40960.4587 1918.9029 1918.9797 -40.03 0 (48) 0.023 1 U R.WAMLGALGCVFPELLAR.N + Oxidation (M) 44670.6395 2008.8966 2009.0155 -59.19 0 42 0.12 1 U R.LAMFSMFGFFVQAIVTGK.G + Oxidation (M) 451005.4635 2008.9124 2009.0155 -51.29 0 (35) 0.56 1 U R.LAMFSMFGFFVQAIVTGK.G + Oxidation (M) 47676.2986 2025.8741 2025.0104 427 0 (22) 12 1 U R.LAMFSMFGFFVQAIVTGK.G + 2 Oxidation (M) 3 Protein information Peptide information 2. gi|47522906 Mass: 60550 Score: 33 Matches: 3(0) Sequences: 2(0) zona pellucida sperm-binding protein 4 [Sus scrofa] Check to include this hit in error tolerant search Query Observed Mr(expt) Mr(calc) ppm Miss Score Expect Rank Unique Peptide 21649.2406 1296.4666 1296.5768 -85.00 0 31 1.1 1 U K.GPGSSMGVEASYR.G 22649.2485 1296.4823 1296.5768 -72.88 0 (21) 10 1 U K.GPGSSMGVEASYR.G 69 1237.2689 3708.7849 3710.1076 -356.51 1 3 6.4e+02 5 U K.YSRPPVDSHALWVAGLLGSLIIGALLVSYLVFRK.W 4 Description of the action Audio Narration Action First show the computer with the screen displaying the search results. This must be zoomed into to clearly depict the report as shown. The green highlight boxes must then appear with their labels. User must be allowed to click on these highlighted regions. Clicking on ‘protein information’ must redirect user to steps 4 (a) & (b) while ‘peptide information’ must redirect user to steps 5(a) & (b). As shown in animaion. The summary report lists all the protein matches obtained from the database search with their respective molecular weight, protein score, source organism and details regarding each of its fragmented peptides. Further information about any of the protein sequences can be obtained by clicking on the corresponding protein link. Data regarding each of the peptide fragmentation patterns can also be obtained by clicking on the peptide link indicated by the query number. 5 www.matrixscience.com
The protein score is a sum of the highest ion scores for each sequence, with duplicate matches being excluded. A score above 67 is considered significant. In this case. Part 3, Step 4 (a) 1 Protein information – data analysis & interpretation Mascot search results Protein view Predicted mass of the protein. Match to: gi|31753114 Score: 225 Unknown (protein for IMAGE:5194336) [Homo sapiens] Found in search of C:\Users\harini\Desktop\MS\3C.LC-MS-MS data analysis Raw data file- mgf files\Data file1.mgf Nominal mass (Mr): 30840; Calculated pI value: 6.00 NCBI BLAST search of gi|31753114 against nr Unformatted sequence string for pasting into other applications Taxonomy: Homo sapiens Links to retrieve other entries containing this sequence from NCBI Entrez: gi|111494016 from Homo sapiens Fixed modifications: Carbamidomethyl (C) Variable modifications: Oxidation (M) Cleavage by Trypsin: cuts C-term side of KR unless next residue is P Sequence Coverage: 14% Matched peptides shown in Bold Red 1 HHHSPTLREH GRRTRTSLLE AMATTAMALS PSSFAGKAVK DLPSSALFGE 51 ARVTMRKTAA KAKPVSSGSP WYGSDRVLYL GPLSGDPPSY LTGEFPGDYG 101 WDTAGLSADP ETFAKNRELE VIHCRWAMLG ALGCVFPELL ARNGVKFGEA 151 VWFKAGSQIF SEGGLDYLGN PSLVHAQSIL AIWACQVVLM GAVEGYRVAG 201 GPLGEIVDPL YPGGSFDPLG LADDPEAFAE LKVKEIKNGR LAMFSMFGFF 251 VQAIVTGKGP LENLADHLSD PVNNNAWAFA TNFVPGK Predicted isoelectric point of the protein. 2 All peptides are displayed with matching peptides indicated in red. Indicates the % of matching peptides. 3 4 Description of the action Audio Narration Action The protein view obtained on selecting a particular protein link, is very similar to the protein view observed in PMF. It provides details regarding the protein score, molecular weight, isoelectric point, the sequence coverage of the protein etc. Protein scores above 67 are considered significant and greater the percentage sequence coverage, more are the number of matching peptides for that particular protein. All sequences are displayed with the matching sequences being indicated in red. As shown in animaion. Show all the text output. Next show the green highlighted boxes one at a time with the corresponding dialogue box appearing for each of the highlighted regions. The results on the next slide must also be displayed along with this page. 5 www.matrixscience.com
Part 3, Step 4 (b) 1 Protein information – data analysis & interpretation Indicates score of each ion fragment. Used for calculation of the protein score. Mascot search results Protein view 2 Indicates beginning & end of each peptide. Observed molecular weight. Experimental molecular weight. Calculated molecular weight. Sequence of peptide fragment. Start - End Observed Mr(expt) Mr(calc) ppm Miss Sequence 126 - 142 960.4446 1918.8746 1918.9797 -55 0 R.WAMLGALGCVFPELLAR.N Oxidation (M) (Ions score 118) 126 - 142 960.4587 1918.9029 1918.9797 -40 0 R.WAMLGALGCVFPELLAR.N Oxidation (M) (Ions score 48) 147 - 154 492.2200 982.4254 982.4913 -67 0 K.FGEAVWFK.A (Ions score 66) 147 - 154 492.2305 982.4464 982.4913 -46 0 K.FGEAVWFK.A (Ions score 40) 147 - 154 492.2348 982.4551 982.4913 -37 0 K.FGEAVWFK.A (Ions score 32) 241 - 258 670.6395 2008.8966 2009.0155 -59 0 R.LAMFSMFGFFVQAIVTGK.G Oxidation (M) (Ions score 42) 241 - 258 1005.4635 2008.9124 2009.0155 -51 0 R.LAMFSMFGFFVQAIVTGK.G Oxidation (M) (Ions score 35) 241 - 258 676.2986 2025.8741 2025.0104 427 0 R.LAMFSMFGFFVQAIVTGK.G 2 Oxidation (M) (Ions score 22) 3 4 Description of the action Audio Narration Action As shown in animaion. Show all the text output. Next show the green highlighted boxes one at a time with the corresponding dialogue box appearing for each of the highlighted regions. Information about each of the matched peptides is also displayed. The start and end amino acid positions, calculated and experimental molecular weights, number of missed tryptic cleavages, sequence of each peptide fragment and their corresponding ion scores are shown. The highest ion scores are used for computing the final protein score. 5 www.matrixscience.com
Part 3, Step 5 (a) Peptide sequence whose fragmentation pattern is shown. 1 Peptide information – data analysis and interpretation Mascot search results Peptide view Range values for the x-axis that can be modified by the user to zoom in or zoom out of the graphical representation. MS/MS Fragmentation of FGEAVWFK Found in gi|31753114, Unknown (protein for IMAGE:5194336) [Homo sapiens] Match to Query 4: 982.425408 from(492.219980,2+) intensity(9920.0000) Title: Sum of 11 scans in range 1333 (rt=1686.21, f=2, i=174) to 1373 (rt=1732.47, f=2, i=184) [\\Qtof\Qtof 17\JAN2004.PRO\Data\6p013-sanjeeva-10.raw] Data file C:\Users\harini\Desktop\MS\3C.LC-MS-MS data analysis Raw data file- mgf files\Data file1.mgf 2 3 4 Description of the action Audio Narration Action As shown in animaion. Show all the text output. Next show the green highlighted boxes one at a time with the corresponding dialogue box appearing for each of the highlighted regions. Each peptide in Tandem MS/MS undergoes a second round of fragmentation when it passes through the second mass analyzer before it reaches the detector. This provides significantly larger amount of information regarding each peptide fragment. This can be viewed by clicking on the peptide links provided in the summary report. The fragmentation pattern is displayed graphically, which can be zoomed into as per the requirement by adjusting the x-axis plot values. 5 www.matrixscience.com
Part 3, Step 5 (b) 1 Peptide information – data analysis & interpretation Mass of the peptide fragment displayed. Mascot search results Peptide view Amino acid sequence obtained through computation using y-ion and b-ion values. Monoisotopic mass of neutral peptide Mr(calc): 982.4913 Fixed modifications: Carbamidomethyl (C) (apply to specified residues or termini only) Ions Score: 66 Expect: 0.00036 Matches : 23/78 fragment ions using 16 most intense peaks (help) b-ions: Ions formed with charge retained on N-terminal. y-ions: Ions formed with positive charge retained on C-terminal. b1 (148.0757) – b2 (205.0972) = 57.0214 G 2 y7 (836.4301) – y6 (779.4087))= 57.0214 G 3 b6 (690.3246) – b7 (837.3930) = 147.0684 F y2 (294.1812) - y1 (147.1128) =147.0684 F 4 Description of the action Audio Narration Action As shown in animaion. At low collision energy, each peptide fragment is cleaved at the amide bond which can result in the formation of two types of ions – the y ion & b ion. In y-ions, the positive charge is retained on the C-terminus of the peptide ion while in b-ions, charge is retained on the N-terminal. These ion masses can be used to compute the amino acid sequence by calculating the mass difference between consecutive ions. Each mass difference value corresponds to a particular amino acid, which can be obtained from a standard information table. The y-ion series & the b-ion series run opposite to each other as indicated in the example above. Show all the text output. Next show the green highlighted boxes one at a time with the corresponding dialogue box appearing for each of the highlighted regions. 5 www.matrixscience.com
Interactivity option 1:Step No:1 1 Based on the mass values indicated in the graph shown below and the table provided showing the average and monoisotopic mass of each amino acid, deduce the sequence of this peptide fragment. 100 299 473 2 75 402 Relative Abundance 601 242 50 530 171 3 769 72 25 0 m/z 4 Options Results Interacativity Type Boundary/limits The correct answer is D. If user chooses this, it must turn green with the message ‘right answer’. If he chooses any of the others, it must turn red, with the message ‘wrong answer’. The graph above with all values & the table shown in the next slide must be displayed. The four option must be shown & user must be allowed to choose any 1 of the 4 options. Choose the correct answer. 5
Interactivity option 2:Step No:2 1 Amino acid3LCSLCAverageMonoisotopic Glycine Gly G 57.0519 57.02146 Alanine Ala A 71.0788 71.03711 Serine Ser S 87.0782 87.02303 Proline Pro P 97.1167 97.05276 Valine Val V 99.1326 99.06841 Threonine Thr T 101.1051 101.04768 Cysteine Cys C 103.1388 103.00919 Leucine Leu L 113.1594 113.08406 Isoleucine Ile I 113.1594 113.08406 Asparagine Asn N 114.1038 114.04293 Aspartic acid Asp D 115.0886 115.02694 Glutamine Gln Q 128.1307 128.05858 Lysine Lys K 128.1741 128.09496 Glutamic acid Glu E 129.1155 129.04259 Methionine Met M 131.1926 131.04049 Histidine His H 137.1411 137.05891 Phenyalanine Phe F 147.1766 147.06841 Arginine Arg R 156.1875 156.10111 Tyrosine Tyr Y 163.1760 163.06333 Tryptophan Trp W 186.2132 186.07931 2 3 4 5 A) AVAGCGGAF Answers: C) AVACCAGAY B) STAGTAGAR D) AVAGCAGAR
Questionnaire 1 1. Which one of these is common across all Mass Spec based proteomics experiments carried out? A) Liquid Chromatography B) ProteolysisC) 2-D Gel Electrophoresis D) Isoelectric Focusing 2. Peptide Mass Fingerprinting or PMF is defined as? A) Finding the best fit for peptides identified by fragmentation. B) Finding the best fir for protein by sequencing in a Triple Quadrupole Analyzer. C) Finding fingerprints of proteins on 2-DE Gels. D) Finding the best fit for masses of peptides identified by MALDI-TOF. 3. Which one of these mass values represents a protein/peptide ion? A) M-H- B) M-H+ C) MH+ D) MH- 4. The average mass of which of the following amino acids corresponds to 87.0782? A) SerineB) Glycine C) AlanineD) Glutamine 2 3 4 5
Links for further reading Reference websites: • http://www.matrixscience.com – The most popular Open shareware site for processing PMF and Tandem Mass Spectrometric data called MASCOT is available here. Research papers: 1. Henzel.W.J., Watanabe.C., Stults.J.T. (2003). Protein Identification: The Origins of Peptide Mass fingerprinting. J Am Soc Mass Spectrom., 14(9)., pp:931-42. 2. Nesvizhskii , A.I., Vitek, O., Aebersold, R. (2007). Analysis and validation of proteomic data generated by tandem mass spectrometry. Nat.Methods., 4(!0), pp.787-97. 3. Deutsch, E.W., Lam, H., Abersold, R. (2008) Data analysis and bioinformatics tools for tandem mass spectrometry in proteomics. Physiol Genomics. 33 (1), pp:18-25. 4. Yates, JR., 2008. Mass Spectrometry and the Age of Proteome. J.Mass.Spec., 33(1), pp.1-19.