Download
1 / 26
390 likes | 1.04k Views
Bond Portfolio Management. Term Structure Yield Curve Expected return versus forward rate Term structure theories Managing bond portfolios Duration Convexity Immunization and trading strategy. Overview of Term Structure. The relationship between yield to maturity and maturity.

E N D
Bond Portfolio Management • Term Structure • Yield Curve • Expected return versus forward rate • Term structure theories • Managing bond portfolios • Duration • Convexity • Immunization and trading strategy
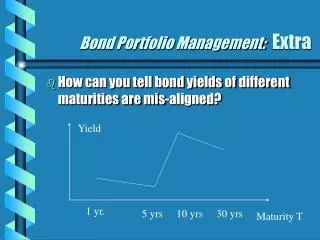
Overview of Term Structure • The relationship between yield to maturity and maturity. • Information on expected future short term rates can be implied from yield curve. • The yield curve is a graph that displays the relationship between yield and maturity. • Three major theories are proposed to explain the observed yield curve.
Figure 15.1 Treasury Yield Curves 1). Pure yield curve; 2). on-the-run yield curve (page 485)
Table 15.1 1-year rate is 5%, 2-year rate is 6%, 3-year rate is 7%, 4-year rate is 8%. Compute the yield to maturity of a 3-year coupon bond with a coupon rate of 10%.
Forward Rates from Observed Rates fn = one-year forward rate for period n yn = yield for a security with a maturity of n
Example: page 487 4 yr = 8.00% 3yr = 7.00% f4 = ?
Downward Sloping Spot Yield Curve Zero-Coupon RatesBond Maturity 12% 1 11.75% 2 11.25% 3 10.00% 4 9.25% 5
Forward Rates Downward Sloping Y C 1yr Forward Rates 1yr= = 0.115006 2yrs= = 0.102567 3yrs= = 0.063336 4yrs= = 0.063008
Theories of Term Structure • Expectation Theory • Forward rate = expected rate (page 494) • Liquidity Premium Theory • Upward bias over expectations • Equation 15.8 on page 499
Duration • A measure of the effective maturity of a bond. • The weighted average of the times until each payment is received, with the weights proportional to the present value of the payment. • Duration is shorter than maturity for all bonds except zero coupon bonds. • Duration is equal to maturity for zero coupon bonds.
Figure 16.2 Cash Flows Paid by 9% Coupon, Annual Payment Bond with an 8-Year Maturity and 10% Yield to Maturity
Example: Duration See page 516-517.
Duration/Price Relationship Price change is proportional to duration and not to maturity. P/P = -D x [(1+y) / (1+y) D* = modified duration D* = D / (1+y) P/P = - D* x y
Rules for Duration Rule 1 The duration of a zero-coupon bond equals its time to maturity. Rule 2 Holding maturity constant, a bond’s duration is higher when the coupon rate is lower. Rule 3 Holding the coupon rate constant, a bond’s duration generally increases with its time to maturity. Rule 4 Holding other factors constant, the duration of a coupon bond is higher when the bond’s yield to maturity is lower. Rules 5 The duration of a level perpetuity is equal to: (1+y) / y
Correction for Convexity Correction for Convexity:
Figure 16.5 Convexity of Two Bonds Which bond does you prefer?
Figure 16.6 Price –Yield of a Callable Bond Negative convexity: page 526; mortgage has the similar feature (page 526, 528)
Passive Management • Bond-Index Funds • Lehman Aggregate Bond index • Salomon Smith Barney Broad Investment Grade (BIG) Index • Merrill Lynch U.S. Broad Market Index • Immunization of interest rate risk: • Net worth immunization Duration of assets = Duration of liabilities • Target date immunization Holding Period matches Duration • Cash flow matching and dedication • Covered in fixed income class
Immunization • Price risk • Reinvestment • Immunization is the point that two effects are cancelled out.
Active Management: Swapping Strategies • The key idea is to predict the interest rate movement • Or simply riding on the yield curve
Yield Curve Ride Yield to Maturity % 1.5 1.25 .75 Maturity 3 mon 6 mon 9 mon