Download
1 / 17
170 likes | 294 Views
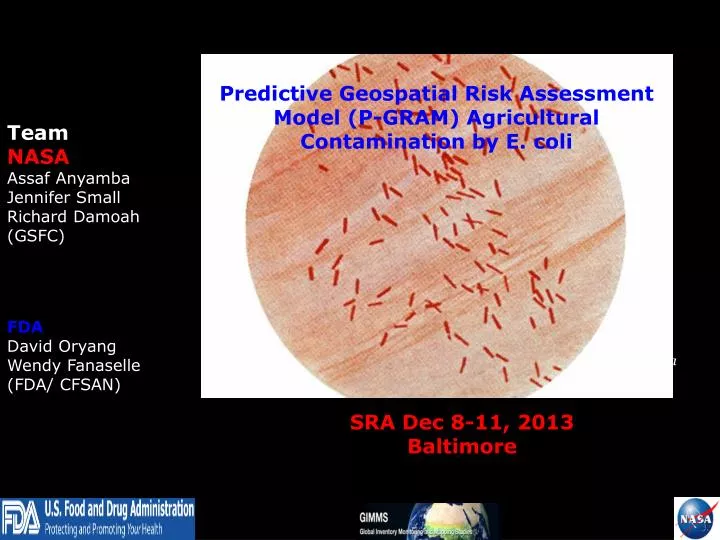
Predictive Geospatial Risk Assessment Model (P-GRAM) Agricultural C ontamination by E. coli. Team NASA Assaf Anyamba Jennifer Small Richard Damoah (GSFC) FDA David Oryang Wendy Fanaselle (FDA/ CFSAN). September 26-30, 2010 Raleigh, North Carolina.

E N D
Predictive Geospatial Risk Assessment Model (P-GRAM) Agricultural Contamination by E. coli Team NASA Assaf Anyamba Jennifer Small Richard Damoah (GSFC) FDA David Oryang Wendy Fanaselle (FDA/ CFSAN) September 26-30, 2010 Raleigh, North Carolina SRA Dec 8-11, 2013 Baltimore
Background – drivers • Precipitation as transport mechanism Cooley, M. et al (2007). “Incidence and tracking of Escherichia coli O157:H7 in a major produce production region in California,” PLoS ONE, 11, e1159.
Seasonal Event Distribution • Implications for pre-harvest contamination of crops • Incidence of environmental contamination peaks in spring, during rainy season • Reported outbreaks peak in fall, after dry period • Relationship between incidence of E. coli in the environment and the occurrence of actual outbreaks is not clearly understood • We hypothesize that runoff in the spring deposits waste contaminated with E.coli near or in agricultural areas makes it possible for greens to be contaminated during the growing season
Spatial Risk Model: PGRAM • 2011 NASS Cropland Data Layer (NASS Cropland Layer updated annually) • Crop mask contains all agricultural land instead of “fruits and vegetables” only • Includes feedlot, dairy and poultry locations from CA Dept of Water Resources Land Use Survey: http://www.water.ca.gov/landwateruse/lusrvymain.cfm • Cumulative precipitation and NDVI anomalies updated every 8 days • Analysis Domain includes CA, NV, AZ From Rangel et al, 2005
Seasonality • Growing Season: September to May: Rain-fed Agriculture • Irrigation – year round? • Risk classification is based on evaluating rainfall leading indicators (precipitation and NDVI) • Overland runoff leads to accumulation of fecal matter and other waste in zones of potential contamination • Rainfall risk category classification • 32 day cumulative total at least 21.3 mm • High risk if anomaly at least 30% • Moderate risk if anomaly at least 15% • Low risk if anomaly at least 5% • NDVI risk category classification • 32 day cumulative total at least 0.2 • High risk if anomaly at least 20% • Moderate risk if anomaly at least 10% • Low risk if anomaly at least 5% • Overall risk is the maximum of the rainfall and NDVI risk classifications
Overview Map Overview map goes here
ARS/FDA Environmental Sampling2011/2012 for Validation • “Salad bowl of America” • Since 1996, at least 11 outbreaks of E. coli have been traced to the Salinas Valley • Source: Mandrell, R. E. 2009. Enteric human pathogens associated with fresh produce: sources, transport, and ecology. In Microbial Safety of Fresh Produce, ed. Xuetong Fan, Brendan A. Niemira, and Christopher J. Doona, 5-41. John Wiley and Sons, September 15.
ARS/FDA Environmental Sampling2011/2012 SUMMARY: RESULTS
Relative Humidity Conditions Regions with Elevation higher than 1000 hPa are shown with no data Gridded products (Level 3) 1º x 1º — daily, 8-day and monthly. • Temperature profiles (24 levels, to 1 mb) • Moisture profiles (12 layers, to 100 mb) • Outgoing long-wave radiation • Surface temperatures Instrument (AIRS) Atmospheric Infrared Sounder aboard Aqua Launch date May 4, 2002 Orbit 705 km Swath width 1650 km Ground coverage >95% global daily
Summary: RH and T Green highlight shows month with no Pathogen Detection
SUMMARY • PGRAM Risk Maps are currently being generated in experimental mode for FDA to monitor at risk areas • Planned improvements will incorporate detailed livestock location data from ARS FLAPS project to enable improved risk characterization • Daily rainfall and Cumulative rainfall anomalies can be use as a general indicator of areas of potential pathogen risk • Generally positive pathogen detections show a positive correlation with RH anomaly. In summer pathogen detections are concentrated in the northern part of region (Salinas Valley)while in winter the detections shift to southeast (Imperial Valley). This is due to the shift of high RH anomaly from north to southeast in winter. • There is need for systematically sampled and geo-referenced produce data on ECO157/Salmonella etc.. from Industry providers for validation.