Download
1 / 86
860 likes | 878 Views
A new theory of gene regulation based on relationships of DNA sequences flanking genes. Richard J. Feldmann Global Determinants, Inc. Derwood, Maryland. The intellectual property presented in this talk/document is protected by US and PCT Patent Applications dated May 30,2001.

E N D
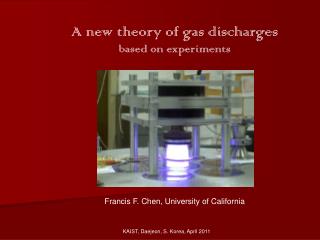
A new theory of gene regulation based on relationships of DNA sequences flanking genes Richard J. Feldmann Global Determinants, Inc. Derwood, Maryland
The intellectual property presented in this talk/document is protected by US and PCT Patent Applications dated May 30,2001
Finding the right question to ask is the hard part • Answering the question is just a matter of hard work.
Have you ever wondered how gene expression is controlled? • The TATA box of a gene is 5’ of the start coding • Small dimeric proteins bind in and near this area • The polymerase assembles around these proteins • Enhancer and/or repressor distal to this area can loop back
Have you ever wondered how cellular differentiation and development is accomplished? • How is gene expression controlled so cells within a tissue are relatively the same? • How in a 1,000 cell creature like C. elegans can all the cells have different functions? • How is cellular development orchestrated?
Simplified Gene Model |<-------------------Promoter----------------->| |<-----Enhancer/Repressor------>|<--TATA Box-->| |<-Beginning of Translation |<--------------Translation Region-------------->| End of Translation----->| + strand ----------------------------------------------------------------------------------------------------------- - strand ----------------------------------------------------------------------------------------------------------- |<-Exon->|<-Intron->|<-Exon->|<-Intron->|<-Exon->| |<-----3'UTR------>| |<--------------------------------------------Gene----------------------------------------------|
Specificity Region • The palindromic specificity area around the TATA box is only 6 to 8 bases in length • 48 = 65,556 is a relatively small number • Not every combination can be used • My sense is that the enhancer/repressor elements only modulate the level of expression
Range of Gene Numbers • Bacteria have 1,000 to 2,500 genes • S. cervesiae has 6,000 genes • C. elegans has 19,000 genes • A. thaliana has 25,000 genes • H. sapiens has 40,000 genes
How many genes are exposed for promotion at a given time? • If the whole compliment of genes is exposed then quantitative regulatory elements have the whole burden of deciding whether a gene is to be expressed or not
Is there a binary mechanism that could sequestrate genes from promotion? • The promoter regions of sequestrated genes would be hidden from the dimeric initiation proteins • The quantitative regulatory elements would have to deal only with the exposed set of genes
Level 1 Level 2 Six Levels of DNA Structure Level 3 Level 4 Level 5 Level 6
Are the level-4 loops random or specific in length? • Is there a sequence specificity to the lengths of these loops? • Could a zinc-finger DNA Binding Protein (DBP) be used to make the loops be specific in length? • Could RNA be used to latch the loops shut?
There are sequence-specific loops! • A simple Fortran program run on yeast showed there are specific sequences on the left and right sides of the level-4 loops • In bacteria, S. servesiae and C. elegans there are not enough DBPs to be able to make a whole-genome mechanism • There are two sequence elements that could be expressed as RNA
Connectron • A left flanking sequence element (T1) of at least 15-bases in length • A right flanking sequence element (T2) of at least 15-bases in length • A pair of sequence elements (C1 and C2) of at least 15-bases in length in the 3’UTR of some gene
Sequence Properties of Connectrons • T1 and T2 have a separation of 0.5kb to 100kb • C1=T1 and C2=T2 • The separation of C1 from C2 is less than 100-bases • The separation of C1/C2 from the end of the gene is less than 1,000-bases
What constraints are placed on the sequences • Only that C1=T1 and C2=T2 • Otherwise any tetrad of non-trivial sequences of at least 15-bases can be used
Connectron Convergence and Divergence • Connectrons form Many-to one relationships • Connectrons form One-to-many relationships
Transient Connectrons • Gene “A” causes some connectron “B” • Some other gene “C” causes a connectron “D” that turns off gene “A” • When gene “C” expresses connectron “B” eventually expires
Permanent Connectrons • Gene “A” causes some connectron “B” but no other connectron ever turns off gene “A”
Hierarchy of Connectrons • Gene “A” causes connectron “B” • Gene “C” causes connectron “D”
Hierarchy of Connectrons • Gene “E” causes connectrons “F” and “G” • Connectron “F” turns off gene “A” which eventually causes connectron “B” to disappear • Connectron “G” turns off gene “C” which eventually causes connectron “D” to disappear
Full Gene Data for Connectron GN 1361 1 1 1191.213 1191.854 .642 ycfc COG2915 GN 1362 1 1 1191.890 1193.041 1.152 ycfb COG0482 GN 1363 1 1 1193.050 1193.511 .462 b1134 COG0494 GN 1364 1 1 1193.521 1194.144 .624 ymfc COG1187 GP 1365 1 1 1194.346 1195.596 1.251 icda COG0538 TN 1366 1 1 1195.576 1195.597 .022 GC *-* GN 1367 1 1 1196.090 1197.460 1.371 ymfd COG0500 | GP 1368 1 1 1197.918 1198.811 .894 lit - | GN 1369 1 1 1198.902 1200.255 1.354 inte - | GN 1370 1 1 1200.292 1200.603 .312 ymfh - | GP 1371 1 1 1200.675 1201.061 .387 ymfi - | GN 1372 1 1 1200.999 1201.283 .285 ymfj - | GN 1373 1 1 1201.482 1202.156 .675 b1145 COG1974 | GP 1374 1 1 1201.944 1202.447 .504 b1146 - | GP 1375 1 1 1202.479 1203.383 .905 ymfl - | GP 1376 1 1 1203.393 1204.760 1.368 ymfn - | GP 1377 1 1 1204.772 1206.720 1.949 ymfr - | GP 1378 1 1 1206.724 1207.353 .630 ycfk - | GP 1379 1 1 1207.355 1207.768 .414 b1155 - | GN 1380 1 1 1207.740 1208.881 1.142 ycfa - | GP 1381 1 1 1208.908 1209.462 .555 pin COG1961 | GP 1382 1 1 1209.569 1210.402 .834 mcra COG1403 | CN 1383 1 1 1210.756 1210.778 .023 .125 GC * | TN 1384 1 1 1210.756 1210.778 .023 GC *-* CN 1385 1 1 1210.780 1210.801 .022 .102 GC * GN 1386 1 1 1210.903 1211.226 .324 ycgw - GN 1387 1 1 1211.926 1212.330 .405 ycgx - GN 1388 1 1 1212.551 1213.282 .732 ycge COG0789 GN 1389 1 1 1213.487 1214.698 1.212 b1163 COG2200 GP 1390 1 1 1215.012 1215.248 .237 ycgz - GP 1391 1 1 1215.291 1215.563 .273 ymga - GP 1392 1 1 1215.592 1215.858 .267 ymgb -
Gene Abstraction for One-Shot Connectron Group0069 Gene_Name COG_Id Chromosome Direction Start Stop Length ymfd COG0500 1 negative 1196.090 1197.460 1.371 lit - 1 positive 1197.918 1198.811 .894 inte - 1 negative 1198.902 1200.255 1.354 ymfh - 1 negative 1200.292 1200.603 .312 ymfi - 1 positive 1200.675 1201.061 .387 ymfj - 1 negative 1200.999 1201.283 .285 b1145 COG1974 1 negative 1201.482 1202.156 .675 b1146 - 1 positive 1201.944 1202.447 .504 ymfl - 1 positive 1202.479 1203.383 .905 ymfn - 1 positive 1203.393 1204.760 1.368 ymfr - 1 positive 1204.772 1206.720 1.949 ycfk - 1 positive 1206.724 1207.353 .630 b1155 - 1 positive 1207.355 1207.768 .414 ycfa - 1 negative 1207.740 1208.881 1.142 pin COG1961 1 positive 1208.908 1209.462 .555 mcra COG1403 1 positive 1209.569 1210.402 .834 • Genes to be abstracted into Group0069 • Final abstraction • Driving C1/C2 NC 483 1 1 1133.952 1195.596 61.644 Non-Controlled-Gene(s) TN 484 1 1 1195.576 1195.597 .022 *-* GG 485 1 1 1196.090 1210.402 14.312 Group0069 | CNT 486 1 1 1210.756 1210.778 .023 OS-> | TN 487 1 1 1210.756 1210.778 .023 *-* CNP 488 1 1 1210.780 1210.801 .022 --> NC 489 1 1 1210.903 1286.207 75.304 Non-Controlled-Gene(s) CNT 486 1 1 1210.756 1210.778 .023 OS-> |
Transient Connectron • Driving C1/C2 • Transient Connectron • Abstracted Groups
Permanent Connectron • Driving C1/C2 • Permanent Connectron • Abstracted Groups
Virtual Connectron - Example 1 • Driving C1/C2 • Virtual Connectron
Virtual Connectron - Example 2 • Driving C1/C2 • Virtual Connectron
Geneless Connectrons • There is a class of connectrons that are not associated with any gene - the so-called “geneless connectrons” or more properly “orf-less connectrons” • The geneless connectrons occur in the non-genic portion of a genome. • There are most probably many hierarchies of geneless connectrons for each cell type.
Orf-less Gene Model |<-------------------Promoter----------------->| |<-----Enhancer/Repressor------>|<--TATA Box-->| |<-Beginning of Translation | End of Translation----->| + strand ------------------------------------------------------------- - strand ------------------------------------------------------------- |<-----3'UTR--------->| |<-C1->|--|<-C2->|
SNPs • Connectrons are resistant to single base mutations. • The RNA forming the two Hoogsteen triple-strand helices is often longer than the minimum 15-base length • Any distribution of the C1/C2 length over the minimum is usable. • Mutations just make weaker X-shaped structure.
Tight X Structure Loose X Structure
Connectrons versus Genome Size • The number of genes in a genome is not particularly correlated with the size of the genome. • The size of the genome is linearly correlated with the number of connectrons.
Connectrons occur across chromosomes • In a multi-chromosonal genome, C1/C2 sources on one chromosome create connectrons on the same and other chromosomes. • S. cervesiae is a wonderful example.
Duplicated Fragments • Connectrons are based on the fact that there are duplicated sequences in a genome. • Many fragments have only a few instances • A few fragments have many instances.
Genes per Group • Many groups of genes controlled by connectrons are only one gene. • In S. cervesiae in particular these one-gene groups are the LTR (Long Term Repeats) • A few groups have many genes • The distribution follows an exponential curve
Distribution of C1/C2 distance from last econ • Many C1/C2 connectron sources occur immediately following the last exon • In S. cervesiae some of the C1/C2s are at extreme distances (i.e.10kb) from the last exon with no intervening genes
Distribution of C1/C2 lengths • Many of the C1/C2 fragments are of the minimum length of 15-bases • A few C1/C2s are very long (i.e. over 100-bases in length) • The distribution follows an exponential pattern