1 / 9

LP TPC Analysis Code and Results

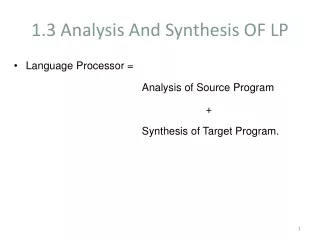
LP TPC Analysis Code and Results. The progress at the Carleton University. Amplitude of Pad. Fit Point Max: Amp = Maximum Pulse Height T0 = Time of bin with maximum signal Quadratic Fit: Amp = Max Pt. of fit T0 = Time of Max Pt. PRF – Pad Response Function. Maximume Amplitude

bianca-cole
Download Presentation

LP TPC Analysis Code and Results

An Image/Link below is provided (as is) to download presentation Download Policy: Content on the Website is provided to you AS IS for your information and personal use and may not be sold / licensed / shared on other websites without getting consent from its author. Content is provided to you AS IS for your information and personal use only. Download presentation by click this link. While downloading, if for some reason you are not able to download a presentation, the publisher may have deleted the file from their server. During download, if you can't get a presentation, the file might be deleted by the publisher.

E N D

Presentation Transcript


  1. LP TPC Analysis Code and Results The progress at the Carleton University

  2. Amplitude of Pad Fit Point Max: • Amp = Maximum Pulse Height • T0 = Time of bin with maximum signal Quadratic Fit: • Amp = Max Pt. of fit • T0 = Time of Max Pt.

  3. PRF – Pad ResponseFunction

  4. Maximume Amplitude • PRF fitting: - Q_ratio • - Synthetic 100 ns peaking time Using half rows

More Related