Download

1 / 48
480 likes | 628 Views
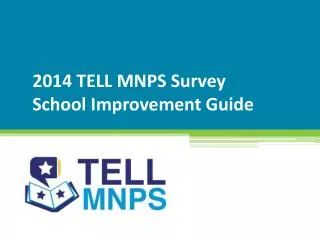
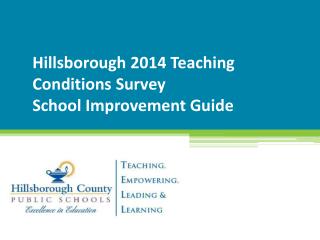
TELL AISD Survey School Improvement Guide. Training Objectives. Become familiar with your school’s data from the 2011 survey results and the TELL AISD website Understand a drill down process in order to analyze the data

E N D
Training Objectives • Become familiar with your school’s data from the 2011 survey results and the TELL AISD website • Understand a drill down process in order to analyze the data • Be able to unpack, disseminate and discuss teaching conditions data to create action items in a planning process for school improvement
What We Know about Teaching Conditions • It matters for kids • It matters for teacher retention • Principals and teachers view teaching conditions differently
School Level Affects Achievement Correlations • Elementary schools showed Leadership as a huge link to achievement • Facilities and Resources had the greatest impact on achievement in Middle Schools in North Carolina • High school evidence reported that Time was the strongest indicator of student achievement
Reform is a Long Term Process According to new research by Linda Darling-Hammond, it takes 30 – 100 hours of professional development extended over a 6 – 12 month period to affect change in the classroom
Uses of the Data • As a baseline for improvement • As a metric (a way to measure) for improvement • As a way to help us prioritize our needs to inform our school improvement plan
Basic TELL Vocabulary • TELL – Teaching, Empowering , Leading and Learning • Teaching and Learning Conditions – the systems, relationships, resources, environments and people in your school that affect your ability to teach (or learn) at a high level • Construct – a grouping of several specific questions, all dealing with the same topic • Time, Facilities and Resources, Community Support and Involvement, Managing Student Conduct, Teacher Leadership, School Leadership, Professional Development, Instructional Practices and Support • Item – a specific individual question
Click on Your School to Access A Detailed Report • Clicking on a school brings up a blue icon • The Detailed Report can be accessed by clicking on the blue icon
Navigating the Detailed Report • Once in the detailed view, you can jump to specific constructs using the clickable construct list to the left of the report (see yellow bracket) • You can also scroll through the document with the mouse • The report can also be printed to PDF (Yellow arrow)
Tools for Working with the Data Results Can be Found Here • Tools are located on the main page, under ‘Links’ • Clicking on ‘Using Your 2011 TELL Data’ will take you to a page containing links to all the tools, prompts, and resources
Use the Construct Indicator Worksheet (located on the website)
Locate your school’s detailed report to each question listed on the worksheet
Fill in Response Rates from the Top Bar (your school’s responses) 2 50
Fill in Response Rates from the Grade Level Bar (similar grade level schools across the entire district) 2 7 50 46
Add the Columns to Determine the Rate of Agreement (Those people who either agreed or strongly agreed) 2 7 + + 50 46 52 53
Subtract Your School Rate of Agreement from the District’s Grade Level Rate of Agreement to Consider How Your School Responded Relative to Similar Level Schools 2 7 50 46 - 1 52 53
Based on the questions from the Construct Indicator Worksheet, Prioritize the Constructs • Each question chosen for the Construct Indicator Worksheet is a strong representative of the Construct it resides in • Looking at results to these questions is a good way to consider which construct to look at more closely • Using these results and the contextual knowledge of your school, consider which construct you would like to look at in detail. • Your construct of focus does not have to be the question with the lowest rate of agreement
Select the Corresponding Construct Item Worksheet from the Website
Examine all of the questions in the construct using the same analysis process
Choose an Individual Item of interest Narrow your focus even further by prioritizing your Items for this Construct • Your item of focus does NOT have to be your lowest item scores • You and your faculty know the context of your school. Use that knowledge to choose an item of greatest impact to explore further
Two Methods Are Available for Examining Individual Items • A linear process for Analyzing an Item • Individual Item Prompts for guiding reflective conversations
Templates and Examples Have Been Designed and Are On the Website For You to Analyze an Item
Use the Templates to Organize Your Thoughts 2.1c: Teachers have time to collaborate.
Method #2: Individual Item Prompts • Are used to guide reflective, collaborative conversations about specific school conditions. • Are a series of reflective prompts for many of the questions in the survey and are available on-line. • Are not the only questions to ask, but provide a starting point for dialogue.
Sample Item Prompt 2.1C: Teachers have time available to collaborate with their colleagues.
Item Prompt Discussion • Assign a Facilitator, Recorder and Reporter. • Reflect upon these questions, or discuss any other questions that arise ON TOPIC. • Record the group’s thoughts. • Everyone should participate fully. • Honor all ideas and be respectful listeners. • Be ready to share key points.
Learn from the Discussions • When working in groups, be sure to assign a recorder to capture all the collective thoughts of the group • People included in the thought process are more likely to participate in improvement initiatives developed from their discussions • Everyone in the school should be engaged in discussions about their working conditions in some capacity
Creating an Action Plan • Use information collected from your item analysis to develop an action plan for improvement • Incorporate Smart Goals into its design • Specific • Measurable and Observable • Attainable • Realistic • Timely • Set a reasonable timeline for follow up discussions about the impact the plan is having
School Improvement Templates and Examples are available online
Douse the findings to inform school and district level decisions about : • Scheduling • Professional development offerings • Opportunities to support and cultivate teacher leadership, collaboration, and • Investments in facilities and resources. • By making TELL AISD data part of the school improvement planning process, findings from each working condition domain can be seamlessly integrated the current and emerging school improvement programs at every school in Austin. Don’t regard this as an attempt to merely document the physical structure and related resources in a school building. • While physical facilities and resources are included in the research base, other complex factors influencing the professional teaching practices of educators are also measured.
Doconsider where administrator perceptions differ considerably from teachers. • Recognize where the divergent views, particularly of teachers and administrators, could limit the potential for meaningful improvement. • Utilize the data as an artifact upon which to base decisions for improvement planning purposes. Don’t consider this process as an accountability tool for principal performance. • The “leadership” category of the TELL AISD survey is intentionally broad to incorporate multiple sources of school leadership, including teacher leadership. • Teaching, empowering, leading, and learning conditions are about schools, not individuals, and it will take the entire school community to improve them.
Douse the findings to help districts move from understanding teaching conditions to taking action toward instructional improvement. • Teams of community members, teachers, principals, administrators, and policymakers should consider using the data as one point of reference in planning for and implementing change in their school. Don’t use the results as a one-shot conversation or a report that sits on the shelf. • The data are only as useful as their potential application for improving real schools.
Doview the results within the context of progress from year-to-year and relative to other groups of schools across a district and the state. • The findings are reported with bars representing the school, district and state averages for TELL AISD questions and constructs. . Don’t use the information within the vacuum of a single school, with fear of comparisons to other schools. • The results will prove more meaningful if used to support collaborative efforts to identify and implement best practices within and among Austin schools.
Douse TELL AISD to help drive local-level policy decisions. • Reviewing data results with local teacher associations, school leadership, local school boards, legislators, and other decision-makers can ensure that policies and resources are more responsive to the most pressing needs of students, educators, schools, and districts. Don’t over- or under-represent the data in local policy decision-making. • Local policymakers should neither ignore the power of teaching conditions data, nor make policy without the context of other data points about the school and/or district.