Download
1 / 14
140 likes | 144 Views
A recent survey conducted by the Tufts Center on the drug development, states that XX% of the drugs that are in the development pipeline include specific biomarkers in their research design. In addition, several biopharmaceutical companies have also increased their investments in precision medicine in the last five years, and the investments are expected to increase at least by another XX% by the next five years. Further, the scientific development and advancements in genomic sequencing, immunotherapy, gene therapy, and disease susceptibility are also expected to boost the precision medicine market in near future.

E N D
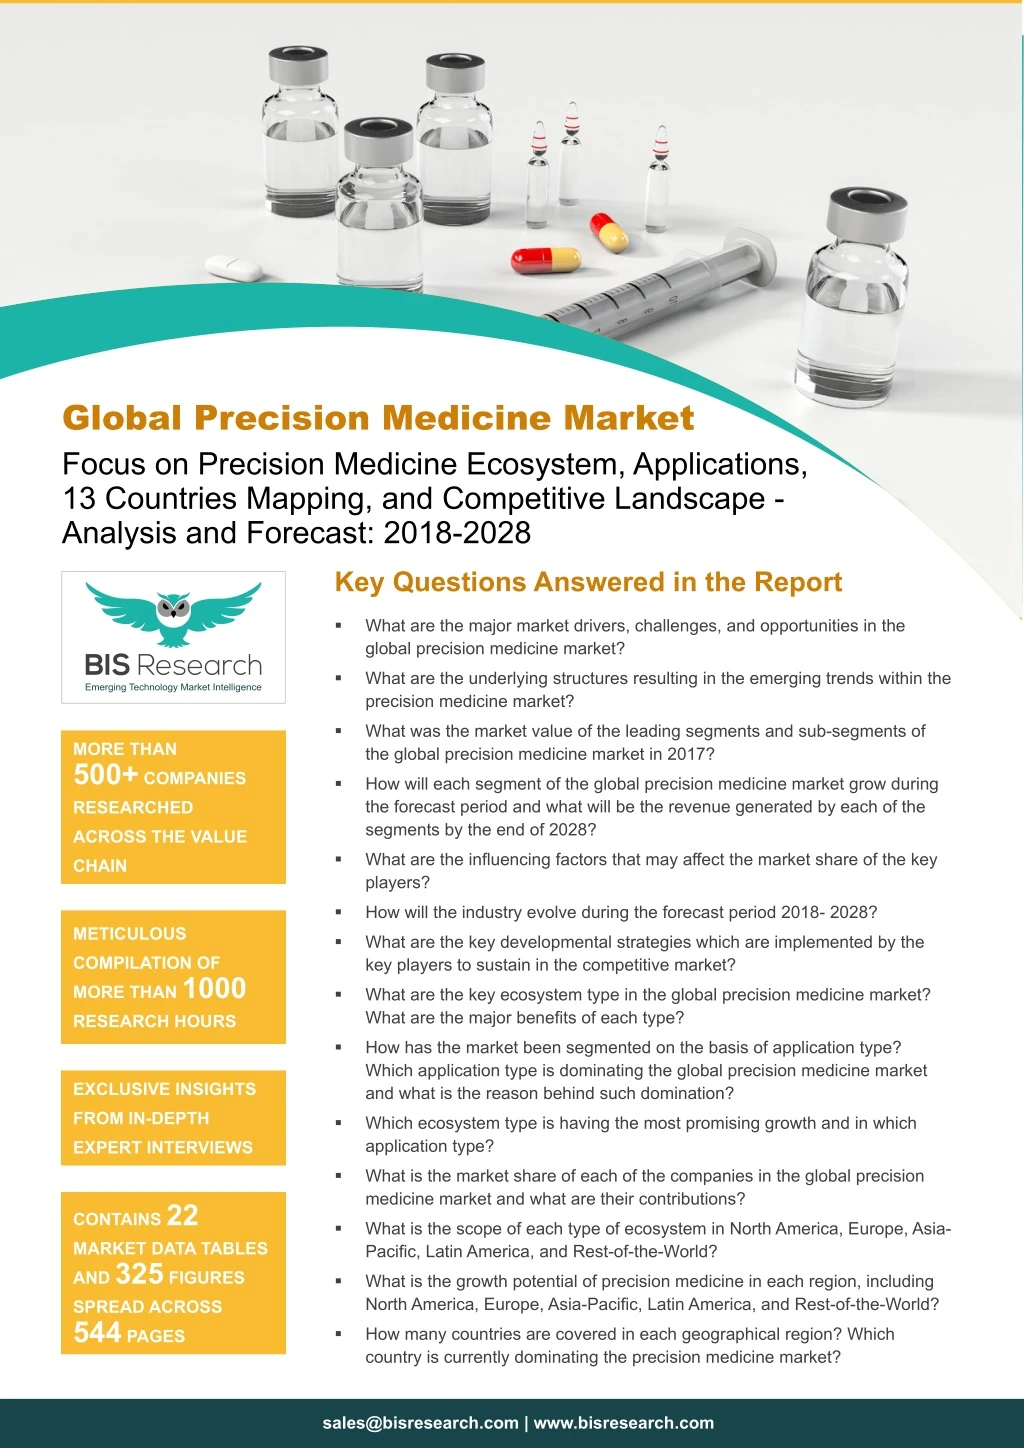
Global Precision Medicine Market Focus on Precision Medicine Ecosystem, Applications, 13 Countries Mapping, and Competitive Landscape - Analysis and Forecast: 2018-2028 Key Questions Answered in the Report What are the major market drivers, challenges, and opportunities in the global precision medicine market? What are the underlying structures resulting in the emerging trends within the precision medicine market? What was the market value of the leading segments and sub-segments of the global precision medicine market in 2017? MORE THAN 500+ COMPANIES RESEARCHED How will each segment of the global precision medicine market grow during the forecast period and what will be the revenue generated by each of the segments by the end of 2028? ACROSS THE VALUE What are the influencing factors that may affect the market share of the key players? CHAIN How will the industry evolve during the forecast period 2018- 2028? METICULOUS What are the key developmental strategies which are implemented by the key players to sustain in the competitive market? COMPILATION OF MORE THAN 1000 RESEARCH HOURS What are the key ecosystem type in the global precision medicine market? What are the major benefits of each type? How has the market been segmented on the basis of application type? Which application type is dominating the global precision medicine market and what is the reason behind such domination? EXCLUSIVE INSIGHTS FROM IN-DEPTH Which ecosystem type is having the most promising growth and in which application type? EXPERT INTERVIEWS What is the market share of each of the companies in the global precision medicine market and what are their contributions? CONTAINS 22 MARKET DATA TABLES AND 325 FIGURES SPREAD ACROSS 544 PAGES What is the scope of each type of ecosystem in North America, Europe, Asia- Pacific, Latin America, and Rest-of-the-World? What is the growth potential of precision medicine in each region, including North America, Europe, Asia-Pacific, Latin America, and Rest-of-the-World? How many countries are covered in each geographical region? Which country is currently dominating the precision medicine market? sales@bisresearch.com | www.bisresearch.com
Table of Contents MARKET OVERVIEW COMPANY PROFILES Abbott Laboratories. Almac Group Ltd. Amgen Inc. ANGLE plc Astellas Pharma Inc. Astra Zeneca PLC ASURAGEN INC. Bio-Rad Laboratories, Inc. bioMérieux SA. Bristol-Myers Squibb Company Canon Inc. CETICS Healthcare Technologies GmbH Danaher Corporation Eli Lilly and Company Limited Epic Sciences, Inc. F. Hoffmann-La Roche AG GE Corporation Gilead Sciences, Inc. GlaxoSmithKline Plc IBM Corporation Illumina, Inc. Intomics A/S Johnson & Johnson Konica Minolta, Inc. Laboratory Corporation of America MDxHealth, Inc. Menarini Silicon Biosystems, Inc. Merck & Co., Inc. Myriad Genetics, Inc. Novartis AG. Oracle Corporation. Pacific Biosciences of California, Inc. Partek, Inc. Pfizer, Inc. QIAGEN N.V Quest Diagnostics Inc. Randox Laboratories Ltd. Sanofi SA Sysmex Corporation Teva Pharmaceuticals Industries Ltd. Thermo Fisher Scientific, Inc. TrovaGene, Inc. Introduction Precision Medicine: A Frontier in the Genesis of Patient-centric Medicine Precision Medicine: Remodeling the One-Size-Fits-All Theory to Individually Tailored Therapy Initiatives and Programs Assumptions and Limitations for Market Size Calculations Precision Medicine: Enabling Technologies MARKET DYNAMICS Impact Analysis Market Drivers Market Restraints Market Opportunities COMPETITIVE INSIGHTS Key Developments and Strategies Market Share Analysis Industry Attractiveness Supply Chain Analysis INDUSTRY INSIGHTS Patent Analysis Legal Requirements and Regulations Pipeline Analysis GLOBAL PRECISION MEDICINE MARKET (BY ECOSYSTEM) Technology Precision Therapeutics Applied Sciences Precision Diagnostics Digital Health and Information GLOBAL PRECISION MEDICINE MARKET (BY APPLICATION) Lifestyle and Endocrinology Gastroenterology Other Applications Oncology Infectious Diseases Neurology/Physiatry Cardiovascular GLOBAL PRECISION MEDICINE MARKET (BY REGION) Latin America Rest-of-the-World (RoW) North America Europe Asia-Pacific (APAC) REPORT SCOPE AND METHODOLOGY Scope of the Report Research Methodology VIEW COMPLETE TABLE OF CONTENT sales@bisresearch.com | www.bisresearch.com
List of Tables 1. Comparison of China and the U.S. Healthcare Statistics 2. Initiatives and Programs 3. Impact Analysis 4. 2015 & 2030) 5. Cancer Incidence by WHO Region, 2012 (Thousands) 6. Cancer Incidence Type in Thousand, 2012 (WHO) 7. Policy and Guidance Documents from the U.S. FDA 8. Pipeline Analysis 9. Precision Medicine Drugs Pipeline Analysis 10. List of Few FDA Approved Pharmacogenomics Biomarkers in Drug Labelling 11. Key Approved Therapeutics with FDA Mandated Companion Diagnostics Tests 12. List of FDA Approved Companion Diagnostics 13. Commercially Available Primary and Secondary Analysis Tools Providers 14. Cancer Precision Medicine Drugs and Indications 15. Recent Key Developments 16. Infectious Diseases Precision Medicine Drugs and Indications 17. Neurology Precision Medicine Drugs and Indications 18. Cardiovascular Precision Medicine Drugs/Tests/ and Indications 19. Endocrinology Precision Medicine Drugs and Indications 20. Gastroenterology Precision Medicine Drugs and Indications 21. Precision Drugs for Other Applications 22. Funding scenario in Universities sales@bisresearch.com | www.bisresearch.com
List of Figures 1. Precision Medicine: Treatment Tailored to an Individual’s Genetic Structure Precision Medicine – a Multi-Faceted Approach to Patient Care Chronic Conditions: Key Statistics: 2017 Long-Term Growth Drivers Impact Analysis Global Precision Medicine Market Snapshot Dominating Segments of Global Precision Medicine Market, 2017 and 2028 Global Precision Medicine Market (by Ecosystem), 2017 and 2028 Global Precision Medicine Market, (by Application), 2017 and 2028 Global Precision Medicine Market (by Region), 2017 and 2028 Notable Areas of Strategic Focus across Influential Countries Strategies Incorporated to Expand the Global Reach Precision Medicine Funding for Academic Institutions and Research Organizations A Persuasive Market Entry Strategy for Diagnostics and Pharma & Biotech Companies to Capitalize on Precision Medicine Plausible Market Penetration Strategy to Shape the Future of Healthcare Go To Market Strategy Value Assessment Frameworks Product/Service Promotion Strategies Precision Medicine: A Trigger to Unfold Innovative Business Model Fixable Gaps in the Field of Precision Medicine Estimated Ratios of Cost per Quality-Adjusted Life Year (QALY) Gained for Precision or Personalized Medicine Tests Impact of Precision Medicine on Researchers, Manufacturers, and Consumers Opportunities and Challenges for Researchers, Providers, and Patients Precision Medicine Approach Evolution of Precision Medicine Technology Precision Medicine: Remodeling the One-Size-Fits- All Theory to Individually Tailored Therapy Precision Medicine: Remodeling Framework Precision Medicine: Enabling Technologies Structured Big Data Reporting Benefits Generalized Process for the Microarray 31. Market Dynamics of Global Precision Medicine Market Total Number of Genetic Products in Market Total Number of Genetic Products in Market % of Patients Whose Tumors Were Driven by Certain Genetic Mutations That Could Be Targets for Specific Drugs Gene Therapy Products in Pipeline Sales Forecast for Gene Therapy Products (Yescarta and Kymriah), $ Million Precision Medicine Deals (2010-2017) Competitive Landscape, January 2012-December 2018 Share of Key Developments and Strategies (January 2012-December 2018) Joint Ventures, Partnerships, Agreements, and Collaborations Share by Companies (January 2012-December 2018) Product launches, Enhancements, and Upgradation Share by Companies (January 2012-December 2018) Product Approvals Share by Companies (January 2012-December 2018) Merger and Acquisitions Share by Companies (January 2012-December 2018) Business Expansion Share by Companies (January 2012-December 2018) Other Developments Share by Companies (January 2012-December 2018) Market Share Analysis by Applied Sciences, 2017 Market Share Analysis by Precision Diagnostics, 2017 Market Share Analysis by Precision Therapeutics, 2017 Market Share Analysis by Digital Health and IT, 2017 Porter’s Five Forces Analysis Definition of Suppliers and Buyers in the Precision Medicine Market Bargaining Power of Suppliers: Overall Impact, 2015-2028 Bargaining Power of Buyers: Overall Impact, 2015-2028 Threat of New Entrant: Overall Impact, 2015-2028 Threat of Substitute Products: Overall Impact, 2014-2028 Intensity of Competitive Rivalry: Overall Impact, 2015-2028 Supply Chain Analysis: Global Precision Medicine Market 2. 32. 33. 34. 3. 4. 5. 6. 7. 35. 36. 37. 38. 8. 9. 39. 10. 40. 11. 41. 12. 13. 42. 14. 43. 15. 44. 16. 17. 18. 19. 45. 46. 47. 20. 21. 48. 49. 50. 51. 22. 23. 52. 24. 25. 26. 53. 54. 55. 27. 28. 29. 30. 56. 57. sales@bisresearch.com | www.bisresearch.com
List of Figures 58. 59. 60. 61. 62. Patent Analysis Role of FDA in Advancing Precision Medicine Precision Medicine: The Ecosystem Global Precision Medicine Market (by Ecosystem) Global Precision Medicine Market (by Ecosystem), 2017-2028 Global Precision Medicine Market (by Applied Sciences) Global Precision Medicine Market (by Applied Sciences), 2017-2028 Precision Medicine: Omics Sciences Global Precision Medicine Applied Sciences Market (by Type), 2017-2028 Precision Medicine: Genomics Global Precision Medicine Genomics Market, 2017-2028 Global Precision Medicine Genomics Market (by Technology), 2017-2028 Global Precision Medicine PCR Market, 2017-2028 Global Precision Medicine PCR Market (by Product Type), 2017-2028 Global Precision Medicine PCR Market (by End User), 2017-2028 Global Precision Medicine PCR Market (by Region), 2017-2028 Evolution of Next-Generation Sequencing Global Precision Medicine NGS Market, 2017-2028 Global Precision Medicine PM NGS Market (by Product Type), 2017-2028 Global Precision Medicine NGS Market (by Technology), 2017-2028 Global Precision Medicine NGS Market (by End User), 2017-2028 Global Precision Medicine NGS Market (by Region), 2017-2028 Global Precision Medicine Genome Editing Market, 2017-2028 Global Precision Medicine Genome Editing Market (by Product Type), 2017-2028 Global Precision Medicine Genome Editing Market (by End User), 2017-2028 Global Precision Medicine Genome Editing Market (by Region), 2017-2028 Global Precision Medicine Other Technologies Market, 2017-2028 Global Precision Medicine Other Technologies Market (by Region), 2017-2028 Clinical Applications of Pharmacogenomics Testing Role of Biomarkers in Pharmacogenomics Role of FDA In Pharmacogenomics Global Precision Medicine Pharmacogenomics Market, 2017-2028 Global Precision Medicine Pharmacogenomics Market (by Pharmacogenomics Services), 2017-2028 Global Precision Medicine Pharmacogenomics Market (by End User), 2017-2028 Global Precision Medicine Pharmacogenomics Market (by Region), 2017-2028 Global Precision Medicine Other Applied Sciences Market, 2017-2028 Precision Medicine: Diagnostics Global Precision Medicine Market (by Precision Diagnostics) Global Precision Medicine Market (by Precision Diagnostics), 2017-2028 Global Precision Medicine Diagnostics Market (by Type), 2017-2028 General Workflow of a Molecular Diagnostic Assay Global Precision Medicine Diagnostics Market (by Molecular Diagnostics) 100. Global Precision Medicine Molecular Diagnostics Market, 2017-2028 101. Global Precision Medicine Molecular Diagnostics Market (by Type), 2017-2028 102. Benefits and Risks Associated with NIPT 103. Global Precision Medicine NIPT Market, 2017-2028 104. Global Precision Medicine NIPT Market (by Platform), 2017-2028 105. Global Precision Medicine NIPT Market (by Region), 2017-2028 106. Drug and Companion Diagnostics Development Process 107. Benefits and Risks Associated with Companion Diagnostics 108. Global Precision Medicine Companion Diagnostics Market, 2017-2028 109. Global Precision Medicine Companion Diagnostics Market (by Technology), 2017-2028 110. Global Precision Medicine Companion Diagnostics Market (by Indication), 2017-2028 111. Global Precision Medicine Companion Diagnostics Market (by Region), 2017-2028 112. Clinical Applications of Liquid Biopsy 113. Global Precision Medicine Liquid Biopsy Market, 2017-2028 114. Global Precision Medicine Liquid Biopsy Market (by Indication), 2017-2028 87. 88. 89. 90. 63. 91. 64. 92. 65. 66. 93. 94. 95. 67. 68. 96. 69. 97. 70. 71. 98. 99. 72. 73. 74. 75. 76. 77. 78. 79. 80. 81. 82. 83. 84. 85. 86. sales@bisresearch.com | www.bisresearch.com
List of Figures 115. Global Precision Medicine Liquid Biopsy Market (by Region), 2017-2028 116. Global Precision Medicine Other Molecular Diagnostics Market, 2017-2028 117. Global Precision Medicine Other Molecular Diagnostics Market (by Type), 2017-2028 118. Global Precision Medicine Other Molecular Diagnostics Market (by Region), 2017-2028 119. Global Precision Medicine Medical Imaging Market, 2017-2028 120. Global Precision Medicine Medical Imaging Market (by Type), 2017-2028 121. Global Precision Medicine Medical Imaging Market (by Region), 2017-2028 122. Global Precision Medicine Imaging Analytics Market, 2017-2028 123. Global Precision Medicine CADx Market, 2017-2028 124. Global Precision Medicine Digital Health and Information Technology Market, 2017-2028 125. Global Precision Medicine Digital Health and Information Technology Market (by Type), 2017-2028 126. Global Precision Medicine Digital Health and Information Technology Market (by End User), 2017-2028 127. Global Precision Medicine Digital Health and Information Technology Market (by Region), 2017-2028 128. Global Precision Medicine CDSS Market, 2017-2028 129. Big Data Attributes 130. Global Precision Medicine Big Data Analytics Market, 2017-2028 131. Big Data Analytics: Key Benefits 132. Global Precision Medicine IT Infrastructure Market, 2017-2028 133. Global Precision Medicine IT Infrastructure Market (by Type), 2017-2028 134. Global Precision Medicine Genomics Informatics Market, 2017-2028 135. Global Precision Medicine Genomics Informatics Market (by Product Type), 2017-2028 136. Global Precision Medicine In-Silico Informatics Market, 2017-2028 137. Global Precision Medicine Mobile Health Market, 2017-2028 138. Global Precision Medicine Therapeutics Market, 2017-2028 139. Global Precision Medicine Therapeutics Market (by Type), 2017-2028 140. Global Precision Medicine Clinical Trials Market, 2017-2028 141. Global Precision Medicine Clinical Trials Market (by Region), 2017-2028 142. Types of Cell Therapy 143. Global Precision Medicine Cell Therapy Market, 2017-2028 144. Global Precision Medicine Cell Therapy Market (by Region), 2017-2028 145. Global Precision Medicine Drug Discovery and Research Market, 2017-2028 146. Global Precision Medicine Drug Discovery and Research Market (by Region), 2017-2028 147. Types of Gene Therapy 148. Types of Gene Therapy 149. Global Precision Medicine Gene Therapy Market, 2017-2028 150. Global Precision Medicine Drug Discovery and Research Market (by Region), 2017-2028 151. Therapeutic Areas in Precision Medicine 152. Global Precision Medicine Applications Market, 2017-2028 153. Types of Cancer 154. Global Precision Medicine Oncology Market, 2017-2028 155. Global Precision Medicine Infectious Diseases Market, 2017-2028 156. Number of Deaths by Top 18 Infectious Diseases, 2015 157. Global Precision Medicine Neurology/Physiatry Market, 2017-2028 158. Global Precision Medicine Cardiovascular Market, 2017-2028 159. Global Precision Medicine Lifestyle and Endocrinology Market, 2017-2028 160. Global Precision Medicine Gastroenterology Market, 2017-2028 161. Global Precision Medicine Other Applications Market, 2017-2028 162. Global Precision Medicine Market (by Region) 163. Global Precision Medicine Market (by Region), 2017 and 2028 164. Global Precision Medicine Market (by Region), 2017-2028 165. North America Precision Medicine Market, 2017-2028 166. North America Precision Medicine Market (by Country), 2017-2028 167. North America Precision Medicine Market (by Ecosystem), 2017-2028 168. The U.S. Precision Medicine Market, 2017-2028 sales@bisresearch.com | www.bisresearch.com
List of Figures 169. Canada Precision Medicine Market, 2017-2028 170. Europe Precision Medicine Market, 2017-2028 171. Europe Precision Medicine Market (by Country), 2017-2028 172. Europe Precision Medicine Market (by Ecosystem), 2017-2028 173. Germany Precision Medicine Market, 2017-2028 174. France Precision Medicine Market, 2017-2028 175. Italy Precision Medicine Market, 2017-2028 176. The U.K. Precision Medicine Market, 2017-2028 177. Spain Precision Medicine Market, 2017-2028 178. Rest-of-Europe Precision Medicine Market, 2017-2028 179. Asia-Pacific Precision Medicine Market, 2017-2028 180. Asia-Pacific Precision Medicine Market (by Country), 2017-2028 181. Asia-Pacific Precision Medicine Market (by Ecosystem), 2017-2028 182. China Precision Medicine Market, 2017-2028 183. Japan Precision Medicine Market, 2017-2028 184. Australia Precision Medicine Market, 2017-2028 185. India Precision Medicine Market, 2017-2028 186. Rest-of- Asia-Pacific Precision Medicine Market, 2017-2028 187. Latin America Precision Medicine Market, 2017-2028 188. Latin America Precision Medicine Market (by Country), 2017-2028 189. Latin America Precision Medicine Market (by Ecosystem), 2017-2028 190. Brazil Precision Medicine Market, 2017-2028 191. Mexico Precision Medicine Market, 2017-2028 192. Rest-of-Latin America Precision Medicine Market, 2017-2028 193. Rest-of-the-World Precision Medicine Market, 2017-2028 194. Major Countries in the Middle East Precision Medicine Market 195. Bio-Rad Laboratories, Inc: Overall Financials, 2015-2017 196. Abbott Laboratories: Revenue (by Business Segment), 2015-2017 197. Abbott Laboratories: Revenue (by Region), 2015-2017 198. Abbott Laboratories R&D Expenditure, 2015-2017 199. Amgen Inc.: Overall Financials, 2015-2017 200. Amgen Inc.: Revenue (by Region), 2015-2017 201. Amgen Inc. R&D Expenditure, 2014-2017 202. ANGLE plc: Overall Financials, 2015-2017 203. ANGLE plc: Revenue (by Region), 2015-2017 204. ANGLE plc R&D Expenditure, 2014-2017 205. Astellas Pharma Inc.: Overall Financials, 2015-2017 206. Astellas Pharma Inc.: Revenue (by Region), 2015-2017 207. Astellas Pharma Inc. R&D Expenditure, 2015-2017 208. Astra Zeneca PLC : Overall Financials, 2015-2017 209. Astra Zeneca PLC: Revenue (by Business Segment), 2015-2017 210. Astra Zeneca PLC: Revenue (by Region), 2015-2017 211. Astra Zeneca PLC R&D Expenditure, 2014-2017 212. Bio-Rad Laboratories, Inc: Overall Financials, 2015-2017 213. Bio-Rad Laboratories, Inc: Revenue (by Business Segment), 2015-2017 214. Bio-Rad Laboratories, Inc: Revenue (by Region), 2015-2017 215. Bio-Rad Laboratories, Inc. R&D Expenditure, 2014-2017 216. bioMérieux SA.: Overall Financials, 2015-2017 217. bioMérieux SA.: Revenue (by Business Segment), 2015-2017 218. bioMérieux SA.: Revenue (by Region), 2015-2017 219. bioMérieux SA. R&D Expenditure, 2014-2017 220. Bristol-Myers Squibb Company: Overall Financials, 2015-2017 221. Bristol-Myers Squibb Company: Revenue (by Region), 2015-2017 222. Bristol-Myers Squibb Company R&D Expenditure, 2015-2017 223. Canon Inc.: Overall Financials, 2015-2017 224. Canon Inc.: Revenue (by Segment), 2015-2017 225. Canon Inc.: Revenue (by Region), 2015-2017 226. Canon Inc.: R&D Expenditure, 2015-2017 227. Danaher Corporation: Overall Financials, 2015-2017 228. Danaher Corporation: Revenue (by Business Segment), 2015-2017 229. Danaher Corporation: Revenue (by Region), 2015-2017 230. Danaher Corporation R&D Expenditure, 2014-2017 231. Eli Lilly and Company Limited: Overall Financials, 2015-2017 232. Eli Lilly and Company Limited: Revenue (by Business Segment), 2015-2017 233. Eli Lilly and Company Limited: Revenue (by Region), 2015-2017 sales@bisresearch.com | www.bisresearch.com
List of Figures 234. Eli Lilly and Company Limited R&D Expenditure, 2014-2017 235. F.Hoffman-LA Roche AG: Overall Financials, 2015-2017 236. F.Hoffman-LA Roche AG: Revenue (by Business Segment), 2015-2017 237. F.Hoffman-LA Roche AG : Revenue (by Region), 2015-2017 238. F.Hoffman-LA Roche AG R&D Expenditure, 2014-2017 239. GE Corporation Limited: Overall Financials, 2015-2017 240. GE Corporation: Revenue (by Business Segment), 2015-2017 241. GE Corporation: Revenue (by Region), 2015-2017 242. GE Corporation R&D Expenditure, 2014-2017 243. Gilead Sciences, Inc.: Overall Financials, 2015-2017 244. Gilead Sciences, Inc.: Revenue (by Business Segment), 2015-2017 245. Gilead Sciences, Inc.: Revenue (by Region), 2015-2017 246. Gilead Sciences, Inc. R&D Expenditure, 2014-2017 247. GlaxoSmithKline Plc: Overall Financials, 2015-2017 248. GlaxoSmithKline Plc: Revenue (by Business Segment), 2015-2017 249. GlaxoSmithKline Plc: Revenue (by Region), 2015-2017 250. GlaxoSmithKline Plc R&D Expenditure, 2014-2017 251. IBM Corporation: Overall Financials, 2015-2017 252. IBM Corporation: Revenue (by Business Segment), 2015-2017 253. IBM Corporation: Revenue (by Region), 2015-2017 254. IBM Corporation R&D Expenditure, 2014-2017 255. Illumina, Inc.: Overall Financials, 2015-2017 256. Illumina, Inc.: Revenue (by Business Segment), 2015-2017 257. Illumina, Inc.: Revenue (by Region), 2015-2017 258. Illumina, Inc. R&D Expenditure, 2014-2017 259. Johnson and Johnson: Overall Financials, 2015-2017 260. Johnson and Johnson: Revenue (by Business Segment), 2015-2017 261. Johnson and Johnson Revenue (by Region), 2015-2017 262. Johnson and Johnson R&D Expenditure, 2014-2017 263. Konica Minolta, Inc.: Overall Financials, 2015-2017 264. Konica Minolta, Inc.: Revenue (by Segment), 2015-2017 265. Konica Minolta, Inc.: Revenue (by Region), 2015- 2017 266. Konica Minolta, Inc.: R&D Expenditure, 2015-2017 267. Lab Corporation of America: Overall Financials, 2015-2017 268. Lab Corporation of America: Revenue (by Business Segment), 2015-2017 269. Lab Corporation of America: Revenue (by Region), 2015-2017 270. MDx Health, Inc.: Overall Financials, 2015-2017 271. MDx Health, Inc. R&D Expenditure, 2014-2017 272. Merck & Co., Inc.: Overall Financials, 2015-2017 273. Merck & Co., Inc.: Revenue (by Business Segment), 2015-2017 274. Merck & Co., Inc.: Revenue (by Region), 2015-2017 275. Merck & Co., Inc. R&D Expenditure, 2015-2017 276. Myriad Genetics, Inc.: Overall Financials, 2015-2017 277. Myriad Genetics, Inc.: Revenue (by Business Segment), 2015-2017 278. Myriad Genetics, Inc.: Revenue (by Region), 2015- 2017 279. Myriad Genetics, Inc. R&D Expenditure, 2015-2017 280. Novartis AG: Overall Financials, 2015-2017 281. Novartis AG: Revenue (by Business Segment), 2015-2017 282. Novartis AG: Revenue (by Region), 2015-2017 283. Novartis AG R&D Expenditure, 2015-2017 284. Oracle Corporation: Overall Financials, 2015-2017 285. Oracle Corporation: Revenue (by Region), 2015- 2017 286. Oracle Corporation R&D Expenditure, 2015-2017 287. Pacific Biosciences of California, Inc.: Overall Financials, 2015-2017 288. Pacific Biosciences of California, Inc.: Revenue (by Region), 2015-2017 289. Pacific Biosciences of California, Inc. R&D Expenditure, 2015-2017 290. Pfizer, Inc.: Overall Financials, 2015-2017 291. Pfizer, Inc.: Revenue (by Business Segment), 2015- 2017 292. Pfizer, Inc.: Revenue (by Region), 2015-2017 293. Pfizer, Inc. R&D Expenditure, 2015-2017 294. QIAGEN N.V: Overall Financials, 2015-2017 295. QIAGEN N.V: Revenue (by Business Segment), 2015-2017 296. QIAGEN N.V: Revenue (by Region), 2015-2017 297. QIAGEN N.V R&D Expenditure, 2015-2017 sales@bisresearch.com | www.bisresearch.com
List of Figures 298. Quest Diagnostics Inc.: Overall Financials, 2015-2017 299. Quest Diagnostics Inc.: Revenue (by Business Segment), 2015-2017 300. Quest Diagnostics Inc.: Revenue (by Region), 2015-2017 301. Sanofi SA: Overall Financials, 2015-2017 302. Sanofi SA: Revenue (by Business Segment), 2015-2017 303. Sanofi SA: Revenue (by Region), 2015-2017 304. Sanofi SA R&D Expenditure, 2015-2017 305. Sysmex Corporation: Overall Financials, 2015-2017 306. Sysmex Corporation: Revenue (by Business Segment), 2015-2017 307. Sysmex Corporation R&D Expenditure, 2015-2017 308. Teva Pharmaceuticals Industries Ltd.: Overall Financials, 2015-2017 309. Teva Pharmaceuticals Industries Ltd.: Revenue (by Business Segment), 2015-2017 310. Teva Pharmaceuticals Industries Ltd.: Revenue (by Region), 2015-2017 311. Teva Pharmaceuticals Industries Ltd. R&D Expenditure, 2015-2017 312. Thermo Fisher Scientific Inc.: Overall Financials, 2015-2017 313. Thermo Fisher Scientific Inc.: Revenue (by Business Segment), 2015-2017 314. Thermo Fisher Scientific Inc.: Revenue (by Region), 2015-2017 315. Thermo Fisher Scientific Inc. R&D Expenditure, 2015-2017 316. TrovaGene,Inc.: Overall Financials, 2015-2017 317. Global Precision Medicine Market Segmentation 318. Figure Scope 319. Key data points from primary resources 320. Key data points from secondary resources 321. Top-down Approach (Segment-wise Analysis) 322. Bottom-Up Approach (Segmental Analysis) 323. Research Methodology Snapshot 324. Assumptions and Limitations 325. Considered Factors for Data Prediction and Modelling sales@bisresearch.com | www.bisresearch.com
Research Scope & BIS Methodology 1. Scope of the Report The report constitutes an in-depth study of the global precision medicine market, including a thorough analysis of the products across different regions. The study also presents a detailed analysis of the market trends, and the market size for the period 2017-2028, wherein 2017 is the base year, and the years from 2018 to 2028 constitute the forecast period. The report covers all the prevalent trends which are expected to play a significant role in the growth of the market over the forecast period. It also highlights various drivers, restraints, challenges, and opportunities which are expected to influence the market’s growth during the forecast period. The report is focused on the global precision medicine market; ecosystem and technology, application, their market dynamics, growth prospect mapping, SWOT analysis, Porter’s Five Forces, market share analysis, pipeline analysis, and country-wise analysis. The study provides a holistic perspective on the market growth, in terms of revenue estimates, across different geographies which include North America, Europe, Asia-Pacific (APAC), Latin America, and Rest of the World (RoW). The report provides cross-sectional analysis of the global precision medicine market in terms of market estimates, and projections, for all the segments across different geographical regions. The regions have been further segmented to cover the in-depth country level analysis. The North American region has been segmented into the U.S., and Canada. Similarly, Europe has been further segmented into the U.K., Germany, France, Spain, Italy, and Rest of Europe. Asia Pacific has been segmented into China, Japan, Australia, India, and Rest of Asia Pacific. Latin America has been segmented into Brazil, Mexico, and Rest of Latin America. Moreover, Rest of the World (RoW) has been further segmented into Middle East and Africa. 2. BIS Research Market Research Methodology The research methodology was an efficient combination of primary and secondary research. For secondary research, several articles, blogs, websites and documents related to the precision medicine market were reviewed. The product literature, press releases, and annual reports of the key market players (public listed companies) were reviewed. As a part of the primary research, in-depth interviews were conducted with a wide range of eminent industry participants, and key opinion leaders that helped in understanding several facets of the market with respect to precision medicine solution providers as well as marketers, tests developers, and buyers. sales@bisresearch.com | www.bisresearch.com
Research Scope & BIS Methodology Figure 1: Research Methodology Scope Definition Research Design Market Study Qualitative Quantitative Primary Interviews/ Secondary Research Top Down and Bottom Up Primary & Secondary Data Report Writing Data Validation Data Analysis Data Collection The market size of precision medicine in $Billion for the year 2017 and 2018 was estimated using a bottom-up approach. This approach involved the estimation of market revenue for each key player revenue on the basis of product and technology and summing them up to arrive at the total global number. For calculating the value of products in a year, the company’s annual reports, press releases, blogs, articles, and white papers were referred to, and the key opinion leaders with significant experience in this market segment were contacted. While estimating the market growth for each product over the forecast period 2018-2028, factors such as the developer’s geographic presence, partnerships and collaborations, products launches, and developments, as well as patents and approvals were considered. For products, whose no real-time data was available in public domain, personnel from the respective companies were contacted in order to gain valuable information pertaining to the product in different regions, and their corresponding prices. The primary sources involve the industry experts from the precision medicine industry including the suppliers, component manufacturers, device manufacturers, and distributors, among others. The resources such as CEOs, vice presidents, marketing directors, and technology and innovation directors, among others, have been interviewed to obtain and verify both qualitative and quantitative aspects of this research study. sales@bisresearch.com | www.bisresearch.com
Research Scope & BIS Methodology The key data points taken from the primary sources include: Validation and triangulation of all the numbers and graphs Validation of report’s segmentation and key qualitative findings Understanding the competitive landscape Current and proposed production values of a particular product by market players Validation of the numbers of the different segments of the market in focus Percentage split of individual markets for regional analysis Demand Side Supply Side Primary Sources Interviews With: Interviews With: • Senior management of the leading biopharmaceutical companies • R&D managers and product managers of the leading players in the industry ► ► • Vice Presidents of diagnostic and pharmaceutical companies • Top research organizations doing research on the future and upcoming precision medicine solutions • Top scientists and professors from universities The research study involves the usage of extensive secondary sources such as databases, company websites, and annual reports. The following figure exhibits the key secondary data sources that have been considered in this research study: Open Sources Paid Databases • SEC Filings of the leading market players • Hoovers • One Source • Factiva Secondary Sources • Company websites and detailed study of their product portfolio • Annual reports, investor presentations of the key players in the market ► ► • Magazines and journals such as Sensor Online, Electronics For You, Quality Magazine, white papers, press releases, news articles etc. Key Data Collected • National Institute of Health(NIH), Center for Disease Control(CDC), Food Drug and Administration(FDA), American Congress of Obstetricians and Gynecologists, American College of Medical Genetics and Genomics (ACMG), American medical Association(AMA), International Federation of Human Genetics Societies(IFHGS), International Genetic Alliance (IGA), International Medical Device Regulators Forum (IMDRF) Key Market Players, Competitive Landscape, Opportunities/ Challenges, Influencing Factors, Market Estimation, and Geographical Analysis The key data points taken from the secondary sources include: • Segmentation breakups, split-ups, and percentage shares • Data for market value • Key industry trends of the top players of the market • Qualitative insights into various aspects of the market, key trends, and emerging areas of innovation • Quantitative data for mathematical and statistical calculations sales@bisresearch.com | www.bisresearch.com
Research Scope & BIS Methodology Figure 2: Data Triangulation The following figure exhibits the data triangulation that have been considered: BIS Research Internal Repository Key Players Competitive Landscape Opportunities/Challenges Market Size and Market Share (2017) Influencing Factors Market Estimates Geographical Analysis Market Trends Bis Research Internal Repository DATA TRIANGULATION Primary Sources Secondary Sources Primary Sources Secondary Sources Supply Side Annual reports from the leading players in the healthcare robotics market SEC Filings 10K reports Investor Presentations Journals Press Releases Paid & Unpaid Databases News Articles The World Bank International Federation of Robotics EDGAR Companies House- GOV.UK Interview With: Top management of leading medical device companies developing healthcare robots C-level executives of start-up companies innovating in the medical device field Scientists and researchers from renowned universities working on healthcare robots Demand Side Healthcare Robots End user: Hospitals Management Physicians Medical Sales Representative Rehabilitation Clinic Management REQUEST FOR SAMPLE sales@bisresearch.com | www.bisresearch.com
BIS Research 39111 Paseo Padre PKWY STE 313, Fremont CA 94538-1686, Tel: +1-510-404-8135 Global Delivery Centre Tapasya Corp Heights, Subarea, Sector 126, Noida, NCR-201303 India Tel: +91 120 4261540 / +91 120 4261544 To know more about us, please visit our website: bisresearch.com For other queries contact: sales@bisresearch.com sales@bisresearch.com | www.bisresearch.com sales@bisresearch.com | www.bisresearch.com