Download
1 / 5
50 likes | 56 Views
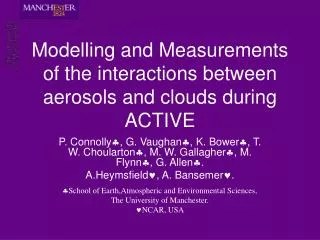
SP2 Measurements during ACTIVE. The SP2 uses Single Particle Laser Induced Incandescence to measure the mass loading of Black Carbon on a particle by particle basis. It is possible to determine the thickness of the coating on black carbon particles

E N D
SP2 Measurements during ACTIVE • The SP2 uses Single Particle Laser Induced Incandescence to measure the mass loading of Black Carbon on a particle by particle basis. • It is possible to determine the thickness of the coating on black carbon particles • Scattering diameter is also derived from the instrument for particles greater than 200 nm. • During ACTIVE, the incandescence signals were triggered using the scattering signal of single particles and so were not measured for sizes below 200 nm. • The first deployment of the Manchester SP2 took place during ACTIVE • It was deployed on the Egrett alternately with NOx • It was not operated in a temperature and pressure controlled housing and so high altitude data are not reliable. • Ascent profile data for particle size are available and have been quality assured and delivered for 8 flights between 27/11/05 and 14/02/2006 • Black carbon mass loading profiles are available on only a limited number of these flights.
SP2 data quality assured flights • The flights and dates on which validated SP2 data were collected is shown, together with the altitude range over which quality assured data were available.
A comparison with data taken on the ER2 aircraft by Schwarz et al [2006]. Schwarz et al [2006]
Comparison of Dornier and Egrett BC Factor of 10?