Download
1 / 15
160 likes | 363 Views
Solar Energy Analysis. with ArcMap. GIS Club at UWM Greg Latsch March 27, 2012. Why Analyze Solar?. To chose croplands To select building sites To estimate potential for solar energy. The Power of the Sun.

E N D
Solar Energy Analysis with ArcMap GIS Club at UWM Greg Latsch March 27, 2012
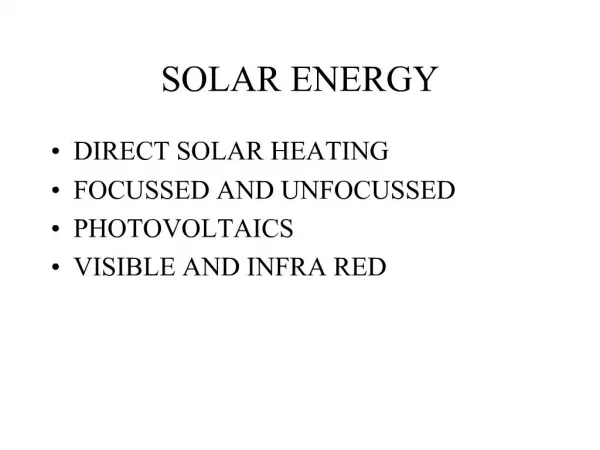
Why Analyze Solar? • To chose croplands • To select building sites • To estimate potential for solar energy Solar Analysis with ArcMap
The Power of the Sun • On average, 1,000 watts of solar energy falls on each square meter of the earth out of 174 petawatts that strikes the earth. • Actual insolation depends on a number of factors… • Latitude • Time of day • Terrain angle(slope) • Terrain direction (aspect) • Shadows from objects like trees and buildings • Air quality • Clouds Solar Analysis with ArcMap
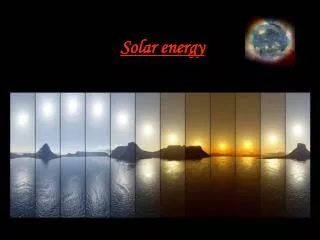
Oblique Sunlight • The lower the sun is in the sky, the less energy falls on a fixed area of the earth. By comparison, only a quarter as much energy falls on a square mile when the sun is 30° above the horizon as does when the sun is overhead. This is an important factor in solar analysis (and it explains the seasons). Solar Analysis with ArcMap
ArcMap Solar Radiation Tools • Within the Spatial Analyst toolbox • Three tools… • Points solar radiation: insolation at a point • Solar radiation graphics: hemispherical sunmap, skymap, and viewshed map • Area solar radiation: insolation for an area. Solar Analysis with ArcMap
Area Solar Radiation • Starts with a raster digital elevation model • Requires input of a number of parameters… • Analysis duration: hours, day range, month, year • Analysis spatial resolution • Others • Most defaults are acceptable • Produces radiation rastersrepresenting… • Direct energy in watt hours per square meter (wh/M2) • Diffuse, whole sky energy (wh/M2) • Sunlight duration (hours) Solar Analysis with ArcMap
Example Analysis • Question at hand: Which downtown rooftops are better locations for photovoltaic panels? Pick one day. In practice, analyze over a year. • Criterion: Rooftops with more insolation are better. • Inputs… • LIDAR digital surface model • Analysis parameters • Outputs… • Whole-sky/global energy raster (wh/M2) • Direct sunlight duration (hours). Solar Analysis with ArcMap
Practical Example • Process • Get LIDAR for analysis area from Milwaukee Co. GIS site. • Open ArcToolbox and select Spatial Analyst Tools>Solar Radiation>Area Solar Radiation • Fill in parameters (a model/macro helps) • Name output raster including optionals at bottom • Select time duration (day number is counted from January 1, time is local solar time) • Click OK • Display and analyze rasters. Solar Analysis with ArcMap
Step 1-Get LIDAR • Get Milwaukee County LIDAR DSM (for example). • Start ArcMap with a blank map. • Add data from ‘GIS Servers’>’Add ArcGIS Server’ • Choose ‘Use GIS Services’ in dialog • Enter ‘http://maps.milwaukeecounty.org/arcgis/services’ • Select ‘arcgis on maps.milwaukeecounty.org’ • Choose ‘LIDAR’ folder trhen ‘DSM5ft’ • Zoom to analysis area • See http://www.county.milwaukee.gov/ImageLibrary/User/bshaw/AccessingLiDARImageService.pdf Solar Analysis with ArcMap
Step 2-Select Area • Export the target area • Zoom to analysis area. • Right click the LIDAR layer and export data frame into a geo-database. Add as a layer. • Remove original LIDAR layer. Solar Analysis with ArcMap
Step 3-Open Solar Tool • Select Spatial Analyst extension in ArcMap ‘Customize’ menu. • Open ArcToolbox and expand ‘Spatial Analyst Tools’. • Select ‘Solar Radiation’. • Double-click ‘Area Solar Radiation’ • ‘Points Solar Radiation’ works in a similar way. • ‘Solar Radiation Graphics’ creates viewshed and skymaps. Solar Analysis with ArcMap
Step 4-Run Analysis • Fill in parameters or build model/macro. • ‘Show Help’ is helpful. • Drag DSM from table of contents as input raster. • Name the output global radiation raster in your GDB. • Pick time configuration of ‘Within a day’. • Set start and end times in local solar time expressed in 24-hour time. • Set hour interval to define integration period. Two hours is reasonable. • Check ‘Create outputs for each interval’. This generates a raster summing the energy or duration within the interval. A six-hour analysis with a two hour interval generates an output raster with three bands. • Click ‘Optional outputs’ and name ‘Output direct duration hours’ in your GDB. • Other defaults are acceptable. • Click ‘OK’ and watch progress bar. A message appears when tool finishes. • Larger areas, higher resolution, and more outputs can add substanial time to the analysis. Solar Analysis with ArcMap
Step 5-Use Analysis • ‘Add Data’ to display output found in your GDB. • ‘Outputs for each interval’ display as multi-band rasters. Select bands individually from your GDB as needed. • The outputs are rasters so all raster tools apply. For example… • Set a threshold value to narrow candidate rooftops • Use raster math to combine rasters. Solar Analysis with ArcMap
To Learn More • Good process outline from Yale Center for Earth Observation: http://www.yale.edu/ceo/Documentation/Calc_%20Solar_Radiation.pdf • ESRI product description: http://webhelp.esri.com/arcgiSDEsktop/9.3/index.cfm?TopicName=Understanding_solar_radiation_analysis Solar Analysis with ArcMap
Ready to Try? Solar Analysis with ArcMap