Download
1 / 27
270 likes | 469 Views
Good Afternoon!. Today we will be learning about Collect and organize data. Let’s warm up :. Express the following decimals as a fraction:. 1) 2 5. 2) 11 20. 1) 0.4. 2) 1.55. 1. Express the following as decimal:. 3) 6.6. 3) 33 5. 4) 14 3.

E N D
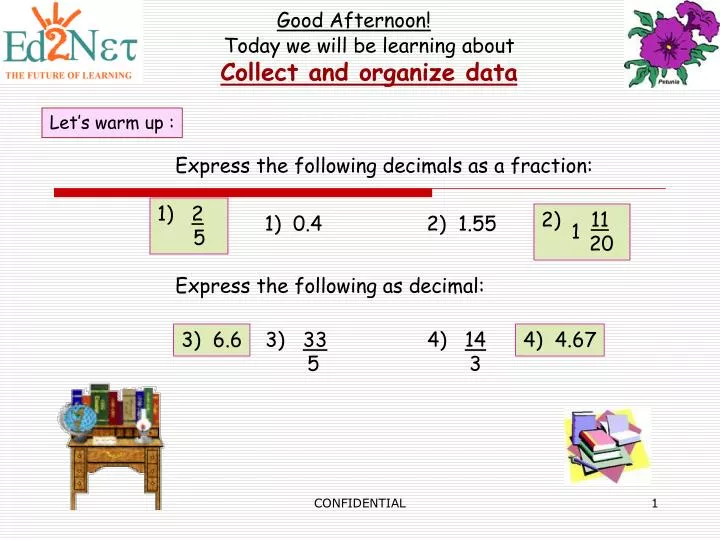
Good Afternoon! Today we will be learning about Collect and organize data Let’s warm up : Express the following decimals as a fraction: 1) 2 5 2) 11 20 1) 0.4 2) 1.55 1 Express the following as decimal: 3) 6.6 3) 33 5 4) 14 3 4) 4.67 CONFIDENTIAL
Let’s start with Collect and organize data Collecting, organizing, displaying, and interpreting data, as well as using the information to make decisions and predictions have become very important in our society. Data is collected, sorted, represented, and interpreted from a variety of sources. Data is then organized, and the information is then comparedafter it has been collected. CONFIDENTIAL
Survey : • A collection of data that answers a question or questions. • Analysis of data collected from the survey allows us to summarize and organize, and even make predictions. • Analyzing data is essential for the growth of students' mathematical understanding. CONFIDENTIAL
How is data collected? • Questionnaires, interviews, and telephone surveys are just a few of the ways that data is gathered. From these collections, tallies, graphs, and line plots are created to help reduce the data into meaningful visual presentations. CONFIDENTIAL
Example: Fourth grade students in Springfield were asked how many miles from town they live. The results of the survey are shown in the data to the right. How many miles do you live from town? 1,2,3,8,7,6,4,5,1,7,7,2,2,3,3,4,4,4,5,5,5,5,5,6,6,6,3,3,4,4,4,5,5 Interpreting information from the above collected unorganized data is difficult. So, we will organize it in the form of a table. CONFIDENTIAL
Table : • An organized grouping of information in rows and columns that makes the information easier to understand. CONFIDENTIAL
The fifth grade students are asked how many pets do they have? Organize the above data in the form of a table. How many pets does each student have? 4,1,3,6,2,4,0,3,1,0,0,5,7,4,2,1,2,3,5,6,2,2,1,8,0,3,2,5,4,1,1 CONFIDENTIAL
Tally • A record of counting by making a mark for each item counted. • The marks, or tallies, are arranged in groups of 5: IIII • A tally chart is used when several things are being counted at once, such as in a survey. • The tally chart in the next slide shows the results of a survey in which students are asked how many miles from town they live? CONFIDENTIAL
Keep track of data in a tally table by making a mark for each thing counted. CONFIDENTIAL
Make a tally table from a frequency chart, showing how many pets does a student have. How many pets does each student have? 4,1,3,6,2,4,0,3,1,0,0,5,7,4,2,1,2,3,5,6,2,2,1,8,0,3,2,5,4,1,1 CONFIDENTIAL
Line plots: are another way to organize data as it is being collected. Line plots organize numerical data along a number line. • The numerical categories in the left column of the tally chart are the same as the numbers displayed along the number line of the line plot. • For each tally in the chart, one X is placed above the corresponding number on the line plot. CONFIDENTIAL
The line plot below shows the results of a survey in which students identified how many miles they live from town. You can see by the number of Xs that more students live 4 miles from town than 6 miles X X X X X X X X X X X X X X X X X X X X X X X X X X X X X X X X X 1 2 3 4 5 6 7 8 Miles from Town CONFIDENTIAL
Make a line plot from a frequency chart, showing how many pets does a student have. How many pets does each student have? 4,1,3,6,2,4,0,3,1,0,0,5,7,4,2,1,2,3,5,6,2,7,1,8,0,3,2,5,4,1,1 X X X X X X X X X X X X X X X X X X X X X X X X X X X X X X X 1 2 3 4 5 6 7 8 0 Number of pets CONFIDENTIAL
BREAK CONFIDENTIAL
GAME Click on the link below for some exciting puzzle http://www.thekidzpage.com/onlinejigsawpuzzles/kids-jigsaw-puzzles/12-piece-jigsaw/09-10-07-bflys.html CONFIDENTIAL
Assignments 1) Organize the following data in the form of a table. The number of siblings of a group of children surveyed are: 1,3,0,2,1,1,3,2,4,3,1,5,3,2,4,3,4,5,1,3,2,5 CONFIDENTIAL
2) Organize the following data in the form of a tally table. The number of siblings of a group of children surveyed are: 1,3,0,2,1,1,3,2,4,3,1,5,3,2,4,3,4,5,1,3,2,5 CONFIDENTIAL
3) Organize the following data in the form of a Line plot . The points scored in a game by a group of children are: 3,9,8,2,4,5,7,5,8,5,9,7,9,4,3,5,6,7,4,3,7,6,8,7,8,4 X X X X X X X X X X X X X X X X X X X X X X 1 2 3 4 5 0 No. of siblings CONFIDENTIAL
4) Make a tally table from a frequency chart, showing how many pages does Sam reads each day. CONFIDENTIAL
5) Make a line plot from a frequency chart, showing how many pages does Sam reads each day. X X X X X X X X X X X X X X X X X X X X X X X X X X X X X X X X X X X X X X X X X X X X X X X X X X X X X X X X X X X X X X Tues Wed Thur Fri Sat Sun Mon Number of pages CONFIDENTIAL
Very Good! Let's Review Data is collected, sorted, represented, and interpreted from a variety of sources. Data is then organized, and the information is then comparedafter it has been collected. • Survey : • A collection of data that answers a question or questions. • Analysis of data collected from the survey allows us to summarize and organize, and even make predictions. • Analyzing data is essential for the growth of students' mathematical understanding. CONFIDENTIAL
Example: Fourth grade students in Springfield were asked how many miles from town they live. The results of the survey are shown in the data to the right. Review How many miles do you live from town? 1,2,3,8,7,6,4,5,1,7,7,2,2,3,3,4,4,4,5,5,5,5,5,6,6,6,3,3,4,4,4,5,5 Interpreting information from the above collected unorganized data is difficult. So, we will organize it in the form of a table. CONFIDENTIAL
Review • Table : • An organized grouping of information in rows and columns that makes the information easier to understand. CONFIDENTIAL
Review • Tally • A record of counting by making a mark for each item counted. • The marks, or tallies, are arranged in groups of 5: IIII CONFIDENTIAL
Review Line plots: are another way to organize data as it is being collected. Line plots organize numerical data along a number line. • The numerical categories in the left column of the tally chart are the same as the numbers displayed along the number line of the line plot. • For each tally in the chart, one X is placed above the corresponding number on the line plot. CONFIDENTIAL
Review The line plot below shows the results of a survey in which students identified how many miles they live from town. You can see by the number of Xs that more students live 4 miles from town than 6 miles X X X X X X X X X X X X X X X X X X X X X X X X X X X X X X X X X 1 2 3 4 5 6 7 8 Miles from Town CONFIDENTIAL
You have done a nice job. See you in the next session. CONFIDENTIAL