Download
1 / 14
140 likes | 238 Views
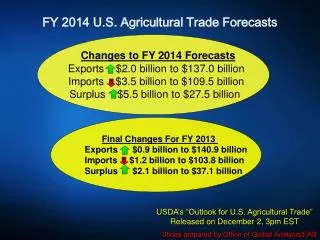
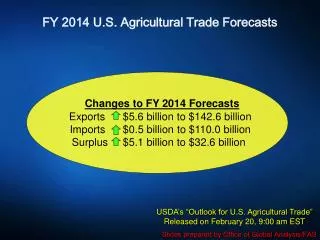
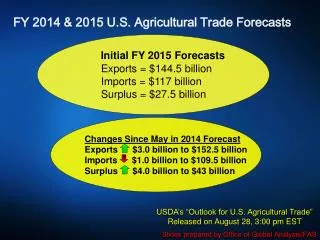
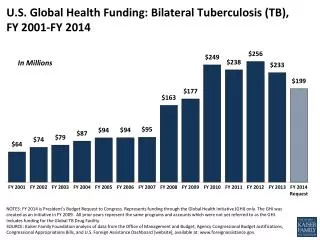
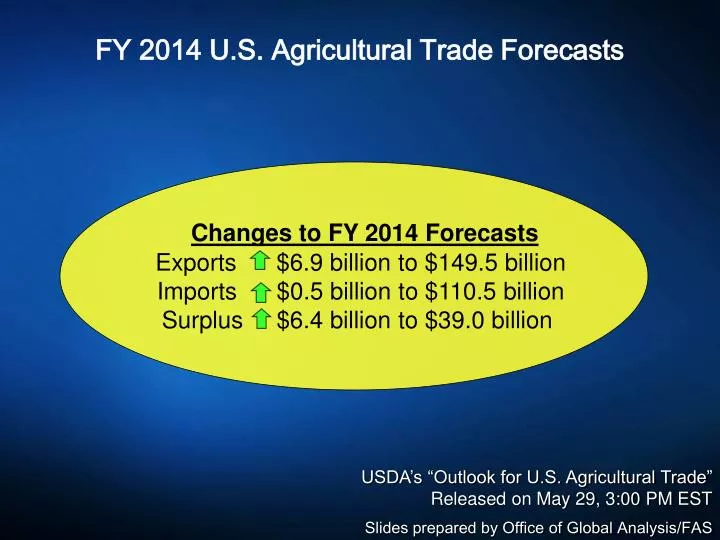
FY 2014 U.S. Agricultural Trade Forecasts. Changes to FY 2014 Forecasts Exports $6.9 billion to $149.5 billion Imports $0.5 billion to $110.5 billion Surplus $6.4 billion to $39.0 billion. USDA’s “Outlook for U.S. Agricultural Trade” Released on May 29, 3:00 PM EST.

E N D
FY 2014 U.S. Agricultural Trade Forecasts Changes to FY 2014 Forecasts Exports $6.9 billion to $149.5 billion Imports $0.5 billion to $110.5 billion Surplus $6.4 billion to $39.0 billion • USDA’s “Outlook for U.S. Agricultural Trade” • Released on May 29, 3:00 PM EST • Slides prepared by Office of Global Analysis/FAS
U.S. Agricultural Trade 149.5 137.4 • Records 110.5 Exports 42.9 • Imports • Trade Surplus
Large gains in grains and oilseeds; slight reduction in horticultural products • May vs. February Commodity Forecasts +$4.5 Billion • -$0.4 Billion +$2.4 Billion • +$0.6 Billion • February • May • No change
Record volume for soybeans and feeds; Corn volume rebounds 166 mmt 146 mmt 130 mmt *Includes cotton, rice, soybean meal, soybean oil, beef & veal, pork, beef and pork variety meats, broiler meat, and tobacco
Dairy, beef, and hides & skins each hit historical highs Record Forecast for Livestock, Poultry, and Dairy
Top 10 U.S. Markets in FY2014 Half of top markets forecast to hit records
Soybeans and Feeds Drive Higher U.S. Exports to China $14.1 B $11.7 B
Exports Up to China, SE Asia, EU, & S. America Change in FY 2014 Exports from February Forecast +$1.5 bil +$3.5 bil +$200 mil -$200 mil +$200 mil +$900 mil +$900 mil
FY 2014 Imports Total $0.5 billion at a record of 110.5 billion Tropical Products$1.0 billion– lower prices for coffee and rubber Horticultural Products$0.2 billion – lower volume of wine Grain and Oilseeds $1.7 billion – record wheat and soybean imports Livestock & Dairy $0.1 billion–higher swine, beef, and pork imports • Other Imports$0.1 billion– mainly tobacco and planting seeds
Export Outlook for Grain & Feed Products Revised FY 2014 Forecast: $35.8 Billion $4.5 Billion 2014 Key Developments • Corn volume up sharply on rising global demand and less competition from Argentina • Wheat prices up on tight supplies and deteriorating crop conditions • DDGS and sorghum up on record demand from China Wild Cards • Timing of South American corn shipments • Northern Hemisphere winter wheat harvests • Wheat export policies in India and Argentina
Export Outlook for Oilseeds & Products Revised FY 2014 Forecast: $33.8 Billion $2.4 Billion 2014 Key Developments • Soybean volume rises on record sales to China • Soybean meal volume up on stronger demand • Strong demand and tight U.S. supplies boost soybean complex prices Wild Cards • Argentina export activity
Export Outlook for Dairy, Livestock, and Poultry Revised FY 2014 Forecast: $32.2 Billion $600 Million 2014 Key Developments • Dairy higher on strong global demand • Beef up mostly on unit values due to robust global demand • Poultry down on lower egg and egg product shipments • Pork edges lower on tighter exportable supplies Wild Cards • PED impact • Ongoing SPS trade issues
Export Outlook for Cotton Revised FY 2014 Forecast: $4.4 Billion Unchanged 2014 Key Developments • China demand slows • Prices remain strong • Wild Cards • Additional changes in China’s reserve policy • Cotton yarn demand in China
Export Outlook for Horticulture Products Revised FY 2014 Forecast: $34.1 Billion Down $400 million 2014 Key Developments • Tree nut growth lower as rising prices weaken Chinese demand • Fresh fruit and vegetables down on lower volumes to Canada and Korea • Wild Card • California Drought Record