Download
1 / 14
140 likes | 148 Views
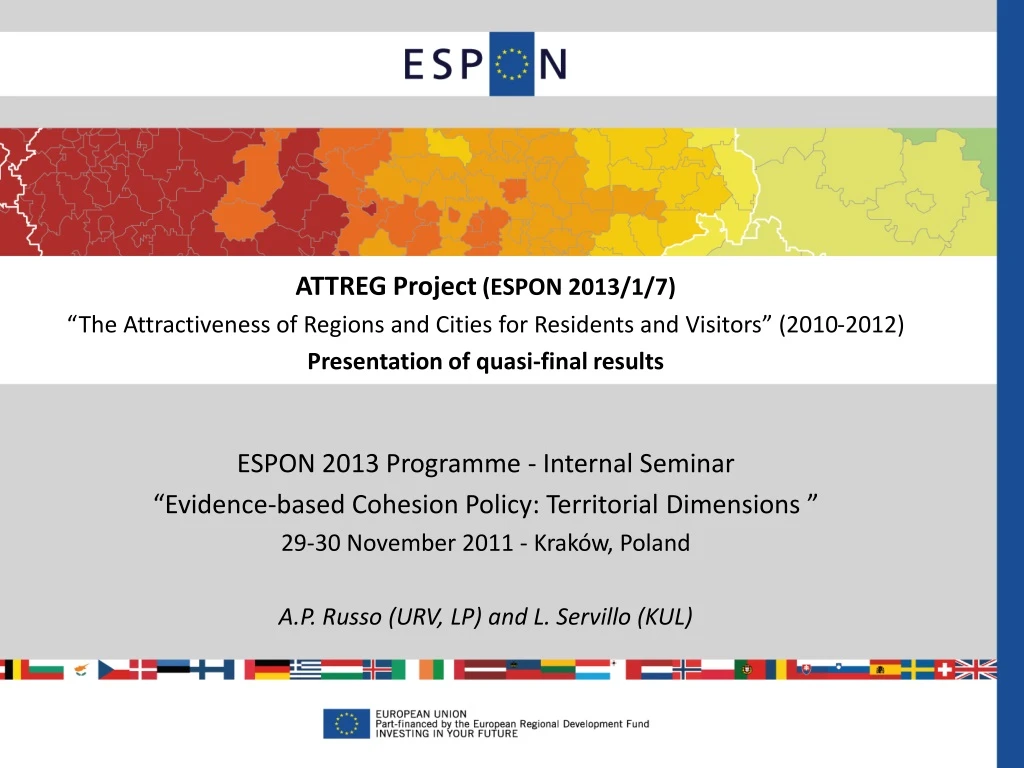
ATTREG Project (ESPON 2013/1/7) “The Attractiveness of Regions and Cities for Residents and Visitors” (2010-2012) Presentation of quasi-final results. ESPON 2013 Programme - Internal Seminar “ Evidence-based Cohesion Policy: Territorial Dimensions ” 29-30 November 2011 - Kraków, Poland

E N D
ATTREG Project (ESPON 2013/1/7) “The Attractiveness of Regions and Cities for Residents and Visitors” (2010-2012) Presentation of quasi-final results ESPON 2013 Programme - Internal Seminar “Evidence-based Cohesion Policy: Territorial Dimensions ” 29-30 November 2011 - Kraków, Poland A.P. Russo (URV, LP) and L. Servillo (KUL)
LEAD PARTNER University Rovira i Virgili (ES) PROJECT PARTNERS KU Leuven (BE) Univ. of Venice Ca’ Foscari (IT) EURICUR Rotterdam (NL) Univ. of Coimbra (PT) Centre for Tourism Research (DK) IGSO (PL) Univ. of Ljubljana (SI) Univ. of West England (UK) RESEARCH SUBCONTRACTOR Istanbul Technological University (TR)
Project background • Objectives of the project • Understanding the attractiveness of territorial assets to different “audiences”, looking into the 2001-08 period • Explaining mains spatial trends, classifying regions accordingly • Investigate these relations at different spatial scales, and focusing on idiosyncrasies and “immeasurable” facts • Developing an analytic framework to asses different policy options • Policy questions • How are regions endowed with territorial capital assets? What is their potential attractiveness for different “audiences”? • How can this potential be liberated? How does governance intervene in this process? • What is to be expected in the future, given the current EU policy scenarios?
Project structure DEFINING AND INTERPRETING ATTRACTIVENESS CONSTRUCTING A DATABASE OF INDICATORS OF TERRITORIAL ASSET ENDOWMENTS DEVELOPING ATTRACTIVENESS TYPOLOGIES AND ESTIMATING THE RELATIONSHIPS BETWEEN ASSETS AND FLOWS VALIDATING / DEEPENING THE ANALYSIS THROUGH CASE STUDY RESEARCH MODELLING SCENARIOS TO UNDERSTAND THE IMPACT OF POLICY DECISIONS INTEGRATING ATTRACTIVENESS AS A MULTI-SCALE POLICY DIMENSION AND PRESENTING THE RESULTS OF “POLICY OPTIONS”
Main results achieved/envisaged • New evidence related to the territorial dimensions of the project • Indicators and regional typologies by flows attracted (discriminating by migrations attracted and by “wavelengths” of mobility): REALISED ATTRACTION • Indicators and regional typologies by endowments of classes of territorial capital: POTENTIAL ATTRACTIVENESS • Model estimates relating A. to B. and identification and classification of outliers: PROCESS INTERPRETATION
Unretentive for young and mid-career age groups, moderately retentive for the older age group Moderate retentiveness for all working age groups High retentiveness for all working age groups Highly retentive for younger age group, moderately retentive for mid-career age group, unretentive for older age group
Average net migration and visiting flow rates Low net migration and visiting flow rates High net migration rate, average visiting flow rate Average net migration rate, high visiting flow rate
Visitor arrivals per head of pop. Balearic Isl. Salzburg CLUSTER 4 average net migration rate, high visiting flow rate Algarve Trento Cornwall Iceland Inner London Prague Noord Holland (Amsterdam) Devon Cyprus Veneto CLUSTER 3 high net migration rate, average visiting flow rate +1 −5 −4 −3 −2 −1 +2 +3 +4 +5 Brussels Catalonia Ile de France Vienna Net migration rate Eastern Finland +1 Slovenia −5 −4 −3 −2 −1 +2 +3 +4 +5 Nord-pas-de Calais (LKT) Hovedstaden (Copengahen) País Vasco Zuid Holland (Rotterdam) Attiki (Athens) Istanbul Van (Eastern Turkey) Lubelskie CLUSTER 1 average net migration and visiting flow rates CLUSTER 2 low net migration and visiting flow rates
CLASS 1 High environmental capital Average-low antropic capital Low economic and institutional capital Low socio-cultural capital CLASS 2 High environmental capital Low antropic and economic cap. Very low institutional and socio-cultural capital CLASS 3 Very high economic, institutional, socio-cultural capital Average antropic cap. Low environmental cap. CLASS 4 High institutional and economic cap. Average high antropic cap. Low environmental and socio-cultural cap. CLASS 5 High socio-cultural cap. Average-high environmental cap. Average-low institutional and antropic cap. Low economic cap.
No (easy) recipes for economic growth Ambiguous relationship between attractiveness and economic growth Economic growth can be one of the effects of retentiveness but not necessarily always of attractiveness – fragility from “overheating” may be the unwanted result (and it did after 2008) A longer term, multi-scale perspective needed Territorial cohesion strategies that successfully address territorial capital are long-term strategies The mobilisation of regional attractiveness based on a combination of top-down EU and state policies and bottom-up initiatives of local and regional stakeholders such as municipalities, universities and businesses Factors to be taken into account: Time issue Coherent aims and targets Place-based approach Strategic spatial (planning) measures EU opportunities Key facts and observations for policymakers
Experiences of the project What are the main experiences of the project with regard to integrating the policy context and the territorial dimensions in the analysis? • Policy dimensions • human mobility as a key dimension of territorial cohesion; attraction policies as part of the EU territorial toolkit • Policy-drive of the analysis • Interrogating policy in exemplary regions • Involving policy stakeholders in our discussions • Territorial dimensions • Regional dimension – main focus of the analysis • Local / national dimension – explored through case studies • EU dimension – addressed in our “scenario” analysis How can this be further strengthened? • Better data at LUZ level • More resources for qualitative research à la URBACT • “Zoom in” specific regions – e.g. tourist regions, transition regions, border regions, etc.
THANKS FOR YOUR ATTENTION! • antonio.russo@urv.cat • loris.servillo@asro.kuleuven.be