Download
1 / 34
340 likes | 343 Views
This overview discusses the levels and application of standard validation rules for waste statistics, focusing on Austria's validation results. It also covers Eurostat's role in cross-validation and the proposed standard validation rules.

E N D
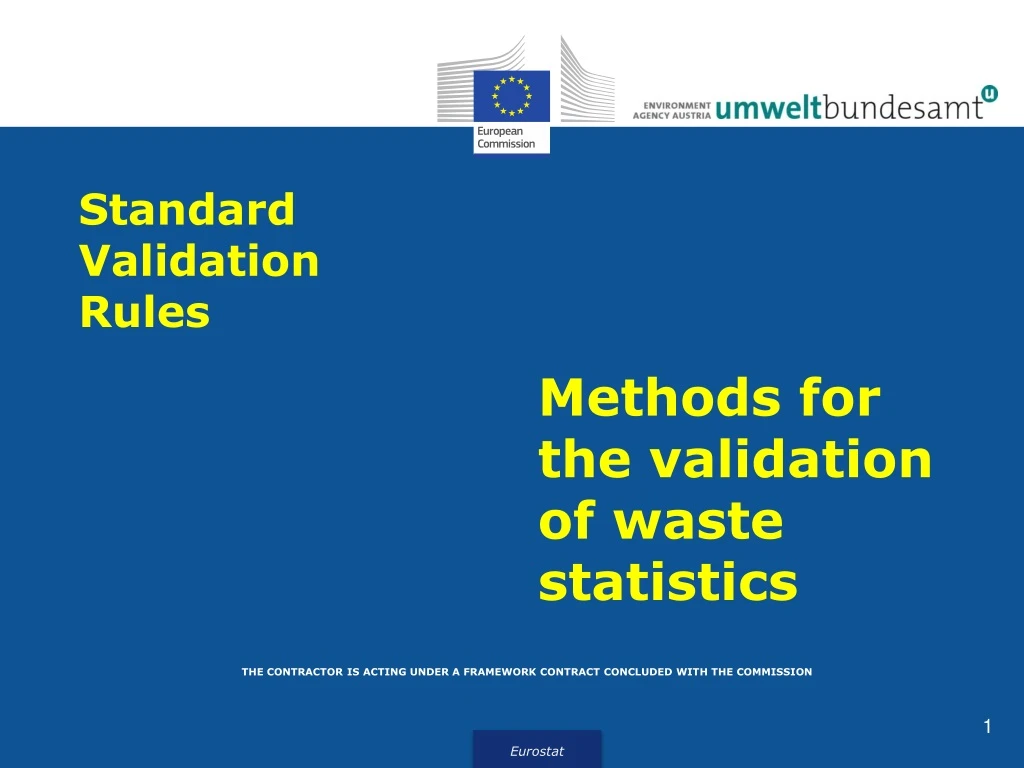
Methods for the validation of waste statistics Standard Validation Rules THE CONTRACTOR IS ACTING UNDER A FRAMEWORK CONTRACT CONCLUDED WITH THE COMMISSION
Overview • Levels of validation of waste statistics • Standard validation rules 1) Explanation of the rules 2)Application of the rules in Austria 3) Main results of the validation rules in Austria
Levels ofdatavalidation Source: Hartmut Schrör (2014). The ESS.VIP Validation General approach and latest developments. Eurostat. ESTP course on wastestatistics 11-12/09/2014.
Validation carried out in the country Main focus: Intra-country validation • Validation throughoutthewholedatacompilationprocess • Validation ofthemicrodata • Validation oftheresults on different levelsofaggregation • Validation ofthe final tablespriortodelivery • Standard validationrules • Cross-validation withotherreportingobligations Co-operation in thevalidationofEurostat
Validation carried out by Eurostat Source: Jürgen Gonser (2012). Validation of WStatR-Data. Argus. ESTP course on wastestatistics24th/25th April 2012.
Standard validation rules • Proposed by Eurostat in 2014 for application by the countries • For final tables • Prior to data delivery. • Application on a voluntary basis • Reporting on theresultsin the Quality reports
Overview of the standard validation rules – four main types of rules 1) Comparison over time a) total /hazardous waste generation by NACE b) hazardous share by NACE c) treatment by operation d) generation & treatment by waste categories e) relation treatment / generation by waste categories f) generation & treatment: largest differences for inner cells 2) Relation generation / treatment (totals) 3) Implausible combinations treatment operation / waste categories 4) Treated amounts vs. treatment capacities (incineration)
Explanation of the rule 1a)Waste generation by NACE • Assumption: Total & hazardous waste generation per NACE sector, respectively, are stable over time. • Data level: Analysis carried out for 18 NACE sectors and households • Calculations: • Step 1: Calculation of indicator variables for current and previous ref. year: • Step 2: Calculation of ratios of the indicators calculated in step 1. • Thresholds: • lower threshold: ratio current/previous < 0.5 • upper threshold: ratio current/previous > 2.0
Results of therule 1a) in Austria • In the activity C24_C25 the ratio is exactly 2,0. Reason for the increase: clarification of the waste status of slags. • The test does not detect the huge increase of the total quantity in the activity F41_F43. Reason for the increase: some bigger construction projects and more comprehensive reporting.
Explanation of the rule 1 b) Hazardous share by NACE • Assumption: Total & hazardous waste generation per NACE sector, respectively, are stable over time. • Data level: Analysis carried out for 18 NACE sectors and households • Calculations: • Step 1: Calculation of indicator variables for current and previous ref. year: • Step 2: Calculation of ratios of the indicators calculated in step 1. • Thresholds: • lower threshold: ratio current/previous < 0.5 • upper threshold: ratio current/previous > 2.0
Results of therule 1b) in Austria • In the NACE-division C19 the threshold is 0,5. Reason: There are shifts between the activities B04-B09 and C19. Thereisonebigconcernwithcompanies in thesetwoactivitycategories.
Explanation of the rule 1 c) Treatment by operation • Assumption: Total & hazardous waste by treatment operation is stable over time. • Data level: Analysis carried out for 6 treatment operations (WST_OPER) and total treatment. • Calculations: Calculation of the ratio of the amounts treated of the current year and those of the previous year: • Thresholds: • lower threshold: ratio current/previous < 0.8 • upper threshold: ratio current/previous > 1.2
Results of therule 1 c) in Austria • In three cases the thresholds are not met: • Incineration without energy recovery: Only one facility and quite low quantities in Austria the relativ change is big, but the absolute change is of low relevance • Landfilling: Some bigger construction projects and more comprehensive reportingof excavated soils are the cause for the increase. • Recycling: The increased total quantity recycled is due to more comprehensive reportingand improved analysis methods.
Explanation of the rule 1 d) Generation by waste categories • Assumption: Waste generationby waste categories is stable over time. • Data level: Comparison carried out for each waste item (51 items) and two SDI • Calculations: • Generation: Calculation of the ratio of the amounts generated for all waste items and the two SDI of the current year and the corresponding values of the previous year: • Thresholds: • lower threshold: ratio current/previous < 0.5 • upper threshold: ratio current/previous > 2.0
Results of therule 1 d) ”generation” in Austria • The thresholds are not met in the category Combustion wastes. Reason: Clarification of the waste status of slags from metall idustry and changes in the classification of slags and ashes from co-incineration. • The test missed big changes in some categories with high total waste generation. In the Quality Report Austria comments on all absolute changes bigger than 200.000 t.
Explanation of the rule 1 d) Treatment by waste categories • Assumption: Waste treatment by waste categories is stable over time. • Data level: Comparison carried out for each waste item (51 items) and two SDI • Calculations: • Treatment: Calculation of the ratio of the amountstreated for all waste item and the two SDI of the currentyear and the corresponding values of the previousyear: • Thresholds: • lower threshold: ratio current/previous < 0.5 • upper threshold: ratio current/previous > 2.0
Results of therule 1 d) ”treatment” in Austria • In eight cases the thresholds are not met. Reasons include: • Real developments • Improved analysis methods (especially for recycling) • Clarification of the waste statusand changes in the classification of specific waste streams • More comprehensive reporting • The test missed big changes in some categories with high total waste treatment. In the Quality Report Austria comments on all absolute changes bigger than 200.000 t.
Explanation of the rule 1 e) Relation treatment/generation by waste categories • Assumption: Relation treatment / generation relatively stable over time and waste category • Data level: Comparison carried out for each waste item (51 items) • Calculations: • Step 1: Calculation of the indicator of the amount treated divided by the amount generated for each waste category for current and previous year:: • Step 2: Calculation of ratios of the indicators calculated in step 1. • Thresholds: • lower threshold: ratio current/previous < 0.5 • upper threshold: ratio current/previous > 2.0
Results of therule 1 e) in Austria • The results are similar to the results of the rule 1 d) • In Austria, all differences between generation and treatment are explainable. Reasons for the differences include: • Pretreatment • Imports / Exports • Temporary storage • Reclassifications
Explanation of the rule 2) Relation generation/treatment (totals) • Assumption: Treated total similar to generated total • Data level: Comparison carried out for total hazardous waste and total non-hazardous waste • Calculations: • Calculation of the ratio of the total amount treated divided by the total amount generated for hazardous and non-hazardous waste: • Optional: Correction for imports and exports of hazardous waste. • Thresholds: • lower threshold: ratio generation/treatment < 0.8 • upper threshold: ratio generation/treatment > 1.15
Results of the rule 2) in Austria • For hazardous wastes, the threshold is not met. Generation > Treatment • The most important reason is pretreatment, especially CP-treatment and pretreatment of contaminated soils • Loss of hazardous characteristics • Weight-losses in CP-treatment
Explanation of the rule 3) Implausible combinations • Assumption: Check the plausibility of treatment by waste types based on combinations of waste category and treatment operations which do not appear plausible. • Data level: Certain combinations of all waste items (51 items) and of all 6 treatment operations. • Calculations: None. • Thresholds:None. The validation will generate a list with all occurrences as defined in the black shaded cells in Table 2. The table is a first approach and should be revised and approved by the countries based on their experience.
Results of the rule 3) in Austria • In Austria, small quantities of metallic and mineral wastes are thermally treated (implausible combination). The data has been verified and the results are correct.
Explanation of the rule 4)Treated amounts vs. treatment capacities • Assumption: : Total amount treated equal or lower than available capacity • Data level: Test applied to total amount (NHAZ & HAZ) treated by: • Incineration with energy recovery (R1) • Incineration without energy recovery (D10) • Calculations: • Calculation of the ratio of the total amount treated by energy recovery and incineration divided by the capacities of the respective treatment operations: • Thresholds: • lower threshold: None • upper threshold: ratio treatment/capacity < 1.0
Application of the rule 4) in Austria and the results Result: The thresholds are met
Contact & Information • Milla Neubauer • milla.neubauer@umweltbundesamt.at Umweltbundesamtwww.umweltbundesamt.at • ESTP course on waste statistics • Wien■ 6.-7.12.2016