Download
1 / 1
10 likes | 101 Views
ND. ob/ob. Supplementary Figure 2. A. IL6. TNF α. IL1 β. IL10. CXCL10. CCL5. CCL2. IL6. TNF α. IL1 β. IL10. CXCL10. CCL5. CCL2. 12000. 2250. 12000. 150. 500. 5000. 15000. 35000. 2000. 10000. 10000. 120. 1750. 30000. 12500. 400. 4000. 8000. 1500. 8000. 25000.

E N D
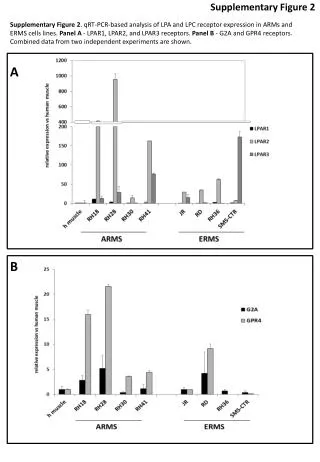
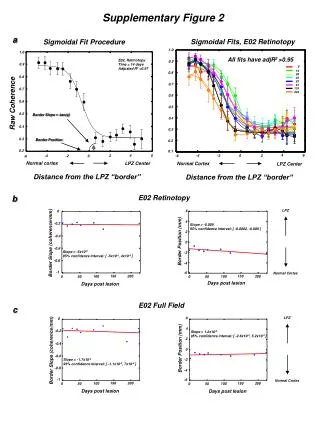
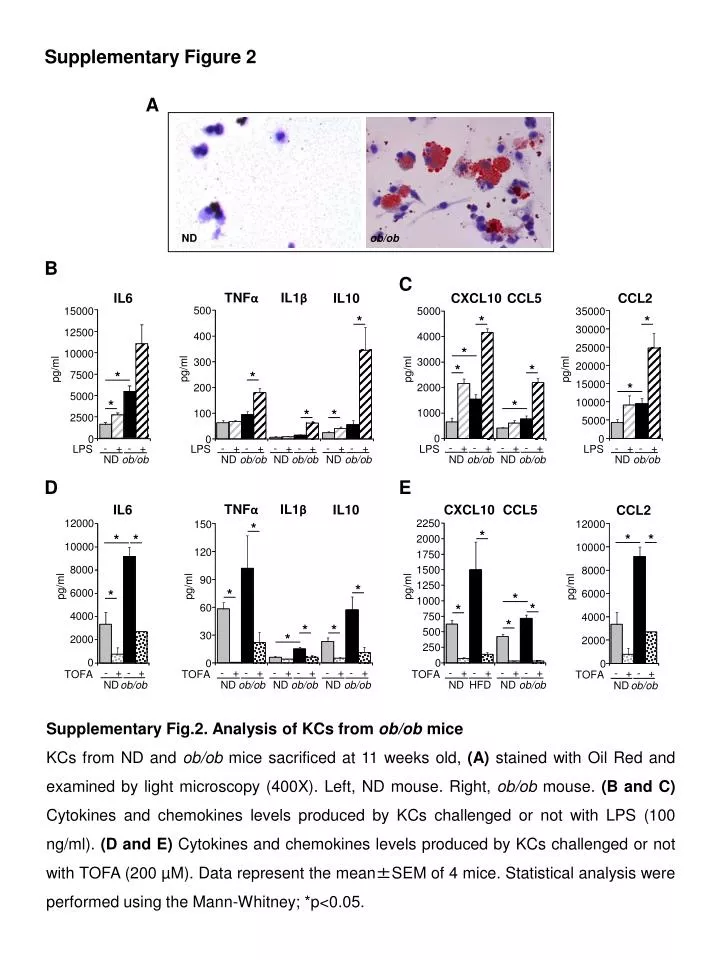
ND ob/ob Supplementary Figure 2 A IL6 TNFα IL1β IL10 CXCL10 CCL5 CCL2 IL6 TNFα IL1β IL10 CXCL10 CCL5 CCL2 12000 2250 12000 150 500 5000 15000 35000 2000 10000 10000 120 1750 30000 12500 400 4000 8000 1500 8000 25000 90 10000 1250 3000 300 6000 20000 6000 pg/ml pg/ml pg/ml pg/ml pg/ml pg/ml pg/ml pg/ml 1000 7500 60 15000 2000 200 4000 750 4000 5000 10000 500 30 2000 1000 2000 100 2500 250 5000 B 0 0 0 0 0 0 0 0 - + - + - + - + - + - + - + - + - + - + - + - + - + - + TOFA TOFA TOFA TOFA - + - + - + - + - + - + - + - + - + - + - + - + - + - + LPS LPS LPS LPS C ob/ob ob/ob ND ND ob/ob ob/ob ob/ob HFD ob/ob ND ND ND ND ND ob/ob ob/ob ob/ob ob/ob ND ob/ob ND ob/ob ND ob/ob ND ND ND ND * * * * * * * * * * * * * * * * * * * * * * * * * * * * * D E Supplementary Fig.2. Analysis of KCs from ob/ob mice KCs from ND and ob/ob mice sacrificed at 11 weeks old, (A) stained with Oil Red and examined by light microscopy (400X). Left, ND mouse. Right, ob/ob mouse. (B and C) Cytokines and chemokines levels produced by KCs challenged or not with LPS (100 ng/ml). (D and E) Cytokines and chemokines levels produced by KCs challenged or not with TOFA (200 µM). Data represent the mean±SEM of 4 mice. Statistical analysis were performed using the Mann-Whitney; *p<0.05.