Download
1 / 28
280 likes | 290 Views
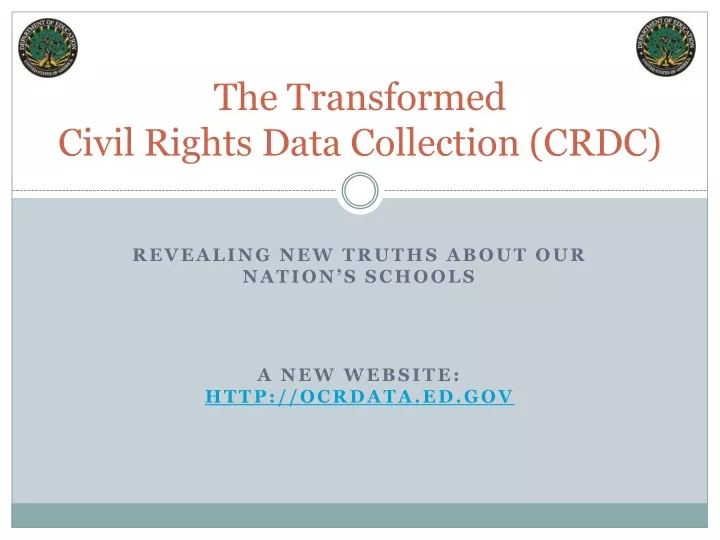
The Transformed Civil Rights Data Collection (CRDC). Revealing new truths about our nation’s schools. A New Website: http://ocrdata.ed.gov. The Revamped CRDC. Bigger than before More detailed and comprehensive More Accessible. Be Empowered With Data.

E N D
The Transformed Civil Rights Data Collection (CRDC) Revealing new truths about our nation’s schools A New Website: http://ocrdata.ed.gov
The Revamped CRDC Bigger than before More detailed and comprehensive More Accessible
Be Empowered With Data “The power of the Civil Rights Data Collection is not only in the numbers themselves, but in the impact it can have when married with the courage and the will to change. The undeniable truth is that the everyday educational experience for many students violates the principle of equity at the heart of the American promise. It is our collective duty to change that.” -- Arne Duncan
Disparate Discipline Rates Discipline The transformed CRDC makes public long-hidden data about which students are suspended, expelled, and arrested in school.
Seclusion and Restraint Students without Disabilities: Seclusion Hispanic students represent 24% of students without disabilities, but 42% of students without disabilities who are subject to seclusion.
Seclusion and Restraint Students with Disabilities: Mechanical Restraint African-American students represent 21% of students with disabilities but 44% of students with disabilities who are subject to mechanical restraint.
Closing the Opportunity Gap Andrew Jackson in Chicago 70% are students of color Almost no achievement gap between groups of students in reading and math at Andrew Jackson. Fewer than 1% of African-American and Hispanic students received an out-of-school suspension
Retention Rates African-American students represent 16% of 6th-8th graders, but 42% of students in those grades held back a year. English Language Learners make up 6% of high school enrollment, but 12% of high school students held back a year.
C0llege and Career Readiness The transformed CRDC shows which students have access to the courses they need to succeed in college and careers.
High and Low Minority Schools Offering Advanced Math and Science
CRDC also reveals: • Course access:Hispanic students make up 20% of the student body at high schools offering calculus, but only 10% of the students taking calculus.
Closing the Opportunity Gap Albert Einstein High School, Montgomery County Public Schools in Maryland, 68% African-American and Hispanic students Enrolled in Physics- 72%
Closing the Opportunity Gap Elizabeth, New Jersey 89% of them Black and Hispanic and Everyone taking Algebra I by the end of 8th grade. Taking and passing rates are representative 95% of students passed the course
CRDC on Enrollment compared to Gifted and Talented Education (GATE)
Closing the Opportunity Gap Fulford Elementary, in Dade County, Florida 600 students 96% of them Black and Hispanic and 90% growing up in poverty. Fulford is outpacing the rest of the sample and their district
Teachers Matter Most: Novice Teachers Teacher Equity The 2009-2010 CRDC provides new insight into which schools employ the most novice teachers, pay the highest (or lowest) salaries, and have the highest rates of teacher absenteeism. Teacher Salary Differences: Elementary Schools
Closing the Opportunity Gap Long Beach Unified, in California, for example, a large and diverse district with 68% Black and Hispanic students, and 67% eligible for free and reduced price lunch
Additional indicators found in the transformed CRDC include: • AP course-taking and test-passing, • SAT and ACT test-taking, • interscholastic athletics, and • bullying and harassment. And a new website makes all this more accessible
The Transformed Civil Rights Data Collection (CRDC) The New Website: http://ocrdata.ed.gov