Download
1 / 35
350 likes | 361 Views
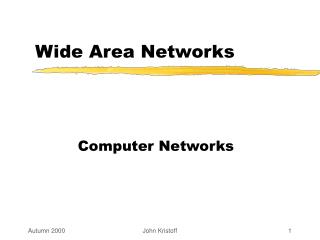
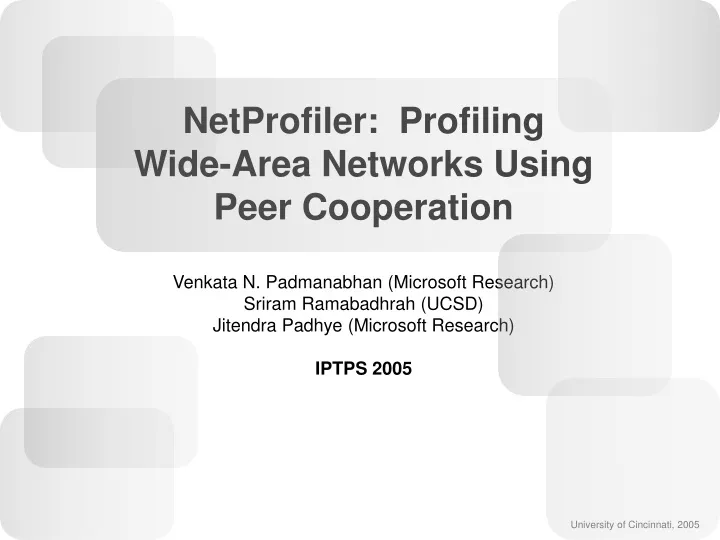
NetProfiler: Profiling Wide-Area Networks Using Peer Cooperation Venkata N. Padmanabhan (Microsoft Research) Sriram Ramabadhrah (UCSD) Jitendra Padhye (Microsoft Research) IPTPS 2005. University of Cincinnati, 2005. Motivation. ISP2. ISP3. Internet. ping. traceroute.

E N D
NetProfiler: Profiling Wide-Area Networks Using Peer Cooperation Venkata N. Padmanabhan (Microsoft Research) Sriram Ramabadhrah (UCSD) Jitendra Padhye (Microsoft Research) IPTPS 2005 University of Cincinnati, 2005
Motivation ISP2 ISP3 Internet ping traceroute Conventional tools do not allow us to view the network from multiple vantage points. ISP1 University of Cincinnati, 2005
Problems • Operators/ISPs: cant really see what kind of network experience there users are having. • Users: cant do much if there are network problems. • Current tools like ping and traceroute capture information only from the perspective of one user • These tools focus only on the IP-level path. Problems maybe with higher layer entities like proxies and servers. University of Cincinnati, 2005
More problems and a solution • Tools like ping and traceroute rely on “active probing”. • Active probing creates overheads especially if too many hosts start probing simultaneously. • Active probing doesn’t always disambiguate the cause of the problem. • Proposed solution: • Hosts accumulate performance information passively, from multiple vantage points, across all layers (not only the IP level path), and the information is aggregated using a p2p network. University of Cincinnati, 2005
Tasks • To acquire performance data from end-user perspective. • To aggregate this data in meaningful ways and share it among cooperating peers. • To use this data for fault analysis and diagnosis. University of Cincinnati, 2005
Outline • NetProfiler • Architecture • Data Acquisition • TcpScope • WebScope • Normalization • Data Aggregation • Attributes • Aggregation Tree • Filtering • Existing Systems • Analysis and Diagnosis • Distributed Blame Allocation • Comparative Analysis • N/W Engg. and Analysis • N/W Health Reporting • Experimental Results • Discussion • Conclusion Task 1: Acquire data
NetProfiler • NetProfiler is the p2p system that is suggested which addresses the issues and problems outlined. University of Cincinnati, 2005
NetProfiler - Architecture • The architecture and design of NetProfiler can be described with respect to the following activities: • Data Acquisition • Normalization • Data Aggregation • Analysis and Diagnosis University of Cincinnati, 2005
NetProfiler – Architecture - Data Acquisition • Data Acquisition • Performed by ‘sensors’. • Sensors are software modules residing on end hosts. • Primarily perform passive observation. • Sensors could be developed for various protocols and applications. • Two sensors were developed • TcpScope (for tcp) • WebScope (for http) University of Cincinnati, 2005
NetProfiler – Architecture - Data Acquisition- TcpScope • TcpScope • Designed to work at the transport layer. • Passive sensor which listens for TCP transfers. • Parameters that are measured include (but are not limited to): • Round Trip Time (RTT) • Congestion Window of sender (cwnd) • Bottleneck bandwidth University of Cincinnati, 2005
NetProfiler – Architecture - Data Acquisition- WebScope • WebScope • If a caching proxy is used, the user loses visibility at the transport layer beyond the proxy. To get around this problem, another sensor called WebScope was developed. • This gives visibility into an end-to-end web transaction. • Cache busting techniques are employed to make sure content is not served from the cache University of Cincinnati, 2005
NetProfiler – Architecture - Data Acquisition • Data Acquisition - Summary • Data is acquired at the hosts by the use of sensors (software modules) • They do not actively probe but listen passively. • Two have been implemented – TcpScope, WebScope. • Measures include – RTT, cwnd, bottleneck bandwidth University of Cincinnati, 2005
Outline • NetProfiler • Architecture • Data Acquisition • TcpScope • WebScope • Normalization • Data Aggregation • Attributes • Aggregation Tree • Filtering • Existing Systems • Analysis and Diagnosis • Distributed Blame Allocation • Comparative Analysis • N/W Engg. and Analysis • N/W Health Reporting • Experimental Results • Discussion • Conclusion Task 2: Aggregate and share data
NetProfiler – Architecture - Normalization • Normalization • Once the data is acquired through sensors, it needs to be aggregated and shared with peers. • But, before that, it must be normalized. • This is required because every host is operating with different parameters such as bandwidth and data transfer rate. University of Cincinnati, 2005
NetProfiler – Architecture – Data Aggregation • Data Aggregation • Sensors are used to gather performance data at each host. • For the system to be meaningful, an efficient aggregation scheme must be devised. • The authors have proposed an aggregation based on a “set of client attributes”. University of Cincinnati, 2005
NetProfiler – Architecture – Data Aggregation - Attributes • Attributes • Hierarchical – impose a natural hierarchy on the hosts along which data can be aggregated. • Example - Geographical Location • Neighborhood -> City -> Region -> Country • Non – hierarchical – used for filtering • Example – Bandwidth class University of Cincinnati, 2005
NetProfiler – Architecture – Data Aggregation – Aggregt’n Tree • Aggregation Tree • A tree which mirrors the hierarchy imposed by the attribute. • Data can be aggregated along this tree. University of Cincinnati, 2005
NetProfiler – Architecture – Data Aggregation – Filtering • Filtering • Hierarchical attributes are used to logically organize the data aggregation. • But as data travels from node to node, it is separated into classes / types based on non-hierarchical attributes of the host. University of Cincinnati, 2005
NetProfiler – Architecture – Data Aggregation – Existing Systems • Existing Systems for distributed monitoring, aggregating and querying on the Internet • SDIMS • Ganglia • Slicestat • IrisNet • PIER • Sophia • Astrolabe The idea here is toleverage these systemsto aggregate data. Thegoalis to develop a system for fault-diagnosisand analysis rather than to design a new data aggregation system. University of Cincinnati, 2005
Outline • NetProfiler • Architecture • Data Acquisition • TcpScope • WebScope • Normalization • Data Aggregation • Attributes • Aggregation Tree • Filtering • Existing Systems • Analysis and Diagnosis • Distributed Blame Allocation • Comparative Analysis • N/W Engg. and Analysis • N/W Health Reporting • Experimental Results • Discussion • Conclusion Task 3: Use data for analysis and diagnosis
NetProfiler – Architecture – Analysis and Diagnosis • Analysis and Diagnosis • So far, the acquisition and aggregation of data has been discussed. • How is the aggregated data used to analyze the system and diagnose commonly occurring problems ? University of Cincinnati, 2005
NetProfiler – Architecture – Analysis and Diagnosis – Dist. Blame Allocation • Distributed Blame Allocation • A client experiencing bad performance will tend to blame the entities involved in the end-to-end transaction. • The idea behind distributed blame allocation is to use data supplied by sensors and other nodes to locate trouble spots. University of Cincinnati, 2005
NetProfiler – Architecture – Analysis and Diagnosis – Comparative Analysis • Comparative Analysis • This is an attractive feature of the profiling system. Clients have information about the performance experienced by neighbors. • This is used to make decisions such as switching to a higher type of service or switching ISPs. University of Cincinnati, 2005
NetProfiler – Architecture – Analysis and Diagnosis – Comparative Analysis • Comparative Analysis - Examples • Am I being treated fairly ? • A client continues to experience worse performance than its neighbors even though they are served by the same ISP…time to change ISPs. Without the aid of NetProfiler, this kind of information cannot be made available. • Should I get a better connection ? • A client has information about the performance experienced by neighbors who are in a higher bandwidth class. This aids in the decision making process. University of Cincinnati, 2005
NetProfiler – Architecture – Analysis and Diagnosis – N/W Engg. & Analysis • Network Engineering and Analysis • Network engineering and analysis is facilitated by NetProfiler performance data. • Example • Network operators may want to choose from a set of alternatives for a company network. Like – leased lines or VPN • Usually, performance data is based on link and router monitoring. • NetProfiler provides and end-user perspective of network performance from multiple vantage points. University of Cincinnati, 2005
NetProfiler – Architecture – Analysis and Diagnosis – N/W Health Reporting • Network Health Reporting • The information gathered by NetProfiler can be used to generate reports about the general health of a wide-area-network. • These reports are available through other means but the advantage of using NetProfiler are greater coverage, lower cost, flexibility and contribution based operation. University of Cincinnati, 2005
Outline • NetProfiler • Architecture • Data Acquisition • TcpScope • WebScope • Normalization • Data Aggregation • Attributes • Aggregation Tree • Filtering • Existing Systems • Analysis and Diagnosis • Distributed Blame Allocation • Comparative Analysis • N/W Engg. and Analysis • N/W Health Reporting • Experimental Results • Discussion • Conclusion
NetProfiler – Experimental Results - Setup • Experimental Results – Setup • Heterogeneous set of clients • 147 PlanetLab nodes, dialup hosts, connected to 26 Pops on MSN network and 5 connected to the Microsoft Corporate Network. • Repeatedly downloading from a diverse set of 70 websites University of Cincinnati, 2005
NetProfiler – Architecture – Experimental Results - Findings • Experimental Results – Findings • Access to a website failed at almost every client. Suggests a server-side problem. • Differences in failure rates among seemingly “equivalent” clients. • A group of nodes sharing an attribute had higher failure rates than all others. This suggests a common cause of the problem affecting these nodes. • [details] University of Cincinnati, 2005
NetProfiler – Experimental Results - Findings • Experimental Results – Findings • Sometimes, problems occurred between a client-server pair. This suggests that there is some problem in the path between these two nodes. [details] University of Cincinnati, 2005
NetProfiler – Discussion • Discussion • Deployment Models • Coordinated • Organic University of Cincinnati, 2005
NetProfiler – Discussion • Organic Deployment - Challenges • Security • Clients may not want to reveal IP or other info. • They may be allowed to report at a “coarser” level, eg. At ISP • Data integrity – malicious users sending incorrect performance data • Bootstrapping – chicken-and-egg • Proposed solution is to allow some active probing in the initial stages University of Cincinnati, 2005
Conclusions • NetProfiler is a system that enables monitoring and diagnosis of • network problems. • It is meant for wide area networks and relies on heavy participation. • It can potentially benefit both ISPs and end users. • Ongoing work includes detection of surreptitious activity to predict • attacks.
End http://geocities.com/alisaif_uc/ppts.htm Saif Ali ECECS University of Cincinnati April 2005
Details of experimental findings System wide failures Most nodes Could not reach the sites www.technion.ac.il and www.hku.hk Discrepancy among seemingly equivalent nodes Among MSN nodes connected to PoPs, those using ICG as the upstream provider experienced lower failure rates than those using other providers like QWEST or UUNET. Group of clients sharing an attribute All 5 hosts on the Microsoft Corporate Network experience high failure rates in accessing a site www.royal.gov.uk whereas failure for other hosts is negligible. Particular Client-Server Pair A Microsoft Corporate Network node in China can never access the site www.nmt.edu whereas others do not have this problem. Back