Download
1 / 50
500 likes | 660 Views
Software Development and Debugging Using SDK. Objectives. After completing this module, you will be able to: Understand the basic concepts of the Eclipse IDE List Xilinx Software Development Kit (SDK) features Describe GNU Debugger (GDB) functionality

E N D
Software Development and Debugging Using SDK This material exempt per Department of Commerce license exception TSU
Objectives After completing this module, you will be able to: • Understand the basic concepts of the Eclipse IDE • List Xilinx Software Development Kit (SDK) features • Describe GNU Debugger (GDB) functionality • Describe Xilinx Microprocessor Debugger (XMD) functionality • Describe the integration of XMD and GDB with SDK
Outline • Software Development Kit • Debugging Tools • Debugging Using XPS • Debugging Using SDK • Simultaneous HW/SW Debug
Xilinx Platform Studio Software Development Kit (SDK) • Java-based application development environment • Based on the open-source effort by the Eclipse Consortium\ • Feature-rich C/C++ code editor and compilation environment • Project management • Application build configuration and automatic Makefile generation • Error Navigation • Well-integrated environment for seamless debugging of embedded targets • Source code version control
Platform Studio SDK Extensions C/C++ Development Perspective Eclipse platform Java Virtual Machine Xilinx Extensions to Eclipse • SDK leverage on Eclipse + CDT (C/C++ Development Toolkit) • Project Management • Makefile builder • Code editor, Error Navigation • Debug • Search • SDK value add to CDT • Debug integration using XMD • Xilinx Custom Compiler settings for PowerPC, MicroBlaze • Profiling Flow and Visualization • Productization
Eclipse/CDT Frameworks More information at: http://www.eclipse.org/cdt/ • Builder framework • Compiles and Links Source files • Default Build options are specified when application is created: Choice of Debug, Release, Profile configurations • User can custom build options later when developing application • Build types: Standard Make, Managed Make • Launch framework • Specifies what action needs to be taken: Run (+ Profile) application or Debug application • In SDK, this is akin to the Target Connection settings • Debug framework • Launches debugger (gdb), loads application and begins debug session • Debug views show information about state of debug session • Hides ugliness of debug details • Search framework • Helps development of application • Help System • Online help system; context-sensitive
Platform Studio SDK SDK Application Development Flow Platform Studio Generate Hardware Platform Create software App Project Generate Software Platform Add sources + Edit libraries, drivers Compile + Link Debug / Profile Done? Import ELF file, Download to board Yes
Workspaces and Perspectives • Workspace • Location to store preferences & internal info about Projects • Transparent to SDK users • In SDK, source files not stored under Workspace • Views, Editors • Basic User interface element • Perspectives • Collection of functionally related views • Layout of views in a perspective can be customized according to user preference
Views • Eclipse Platform views: Navigator view, Tasks view, Problems view • Debug views: Stack view, Variables view • C/C++ views: Projects view, Outline view
Opening Perspectives and Views • To open a Perspective, use Window Open Perspective • To open a view, use Window Show View If the view is already present in the current perspective, the view is highlighted
Editors • bracket matching • syntax coloring • content assist • refactoring • keyboard shortcuts
SDK Workbench C/C++ project outline displays the elements of a project with file decorators (icons) for easy identification C/C++ editor for integrated software creation Code outline displays elements of the software file under development with file decorators (icons) for easy identification Problems, Console, Properties view lists output information associated with the software development flow 1 2 1 3 2 3 4 4
Outline • Software Development Kit • Debugging Tools • Debugging Using XPS • Debugging Using SDK • Simultaneous HW/SW Debug
Introduction • Debugging is an integral part of embedded systems development • The debugging process is defined as testing, stabilizing, localizing, and correcting errors • Two methods of debugging: • Hardware debugging via a logic probe, logic analyzer, in-circuit emulator, or background debugger • Software debugging via a debugging instrument • A software debugging instrument is source code that is added to the program for the purpose of debugging • Debugging types: • Functional debugging • Performance debugging
Hardware Debugging Support • ChipScope™ Pro tool cores are now included for adding to a Xilinx Platform Studio design • PLB IBA (Integrated Bus Analyzer) • OPB IBA • VIO (Virtual I/O) • ChipScope Pro tool evaluation version shipped with the EDK • Analyzer evaluation ends after 90 days • Core insertion/generation works indefinitely • Supports Solaris OS and Windows platforms • Linux to be added in an upcoming release • Enables co-debug of software with GNU gdb and hardware with ChipScope Analyzer
Software Debugging Support • EDK supports software debugging via: • GNU Debugger (GDB) tools • Unified interface for debugging and verifying MicroBlaze and PowerPC systems • Xilinx Microprocessor Debugger (XMD) • Runs all of the hardware debugging tools and communicates with the hardware • GNU tools communicate with the hardware through XMD
MB Cycle-Accurate Instruction Set Simulator XMD stub GDB Functionality Tcl/Terminal Interface Host Software Host Software Host Software Host Software GDB Remote Protocol GDB Remote Protocol User Interface User Interface XMD PowerPC-eabi-gdb mb-gdb (TCP/IP) (TCP/IP) JTAG JTAG UART JTAG MDM UARTlite PPC405 Debug Port JTAG UART Target Hardware PowerPC™ System MicroBlaze™ System MicroBlaze System
GDB Functionality • GDB is a source-level debugger that helps you debug your program • Start your program • Set breakpoints (make your program stop on specified conditions) • Examine what has happened, when your program encounters breakpoints • Registers • Memory • Stack • Variables • Expressions • Change things in your program so that you can experiment with correcting the effects of one bug and go on to another • You can use GDB to debug programs written in C and C++
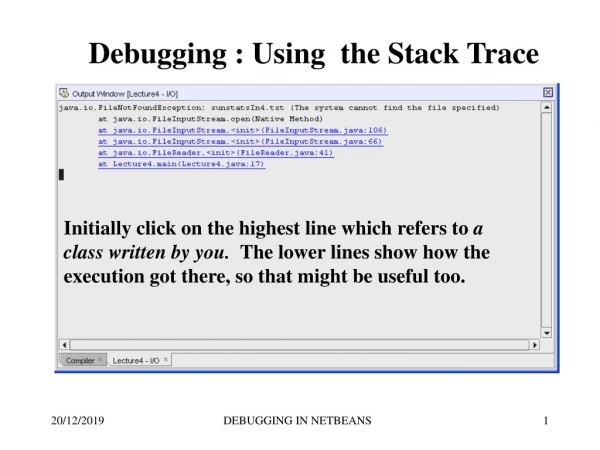
Assembly Instructions Memory Location C Code GDB
GDB GUI • Runtime control • S: Step by source lines (Step into functions) • SI: Step by machine instruction • C: Continue to next breakpoint • N: Next source line (Steps over functions) • NI: Next machine instruction • F: Finish (Ignores all breakpoints)
GDB Functionality • Breakpoints can be enabled or disabled • To change any memory value, simply double-click in a memory field
GDB Functionality • Blue represents registers that have changed • To change any value, double-click in a field
MB Cycle-Accurate Instruction Set Simulator XMD Functionality Tcl/Terminal Interface Host Software Host Software Host Software Host Software GDB Remote Protocol GDB Remote Protocol User Interface User Interface XMD PowerPC-eabi-gdb mb-gdb (TCP/IP) (TCP/IP) JTAG JTAG UART JTAG MDM UARTlite PPC405 Debug Port JTAG UART Target Hardware XMD stub MicroBlaze System PowerPC™ System MicroBlaze™ System
XMD Functionality • Xilinx Microprocessor Debug (XMD) engine • A program that facilitates a unified GDB interface • A Tool command language (Tcl) interface • XMD supports debugging user programs on different targets: • Cycle-accurate MicroBlaze processor instruction set simulator • MicroBlaze systems running xmdstub on a hardware board • MicroBlaze systems using the MDM peripheral • PowerPC systems on a hardware board • mb-gdb and powerpc-eabi-gdb communicate with xmd by using the Remote TCP protocol and controlling the corresponding targets • GDB can connect to xmd on the same computer or on a remote computer on the Internet
XMD Tcl Interface • x?: lists all Tcl commands • xrmem target addr [num]: Reads num bytes or 1 byte from the memory address addr • xwmem target addr value:Writes an 8-bit byte value at the specified memory addr • xrreg target [reg]: Reads all registers or only register number reg • xwreg target reg value:Writes a 32-bit value into register number reg • xdownload target [-data] filename [addr]: Downloads the given ELF or data file (with -data option) onto the memory of the current target • xcontinue target [addr]: Continues execution from the current PC or from the optional address argument • xstep target:Single steps one MicroBlaze processor instruction. If the PC is at an IMM instruction, the next instruction is executed as well
MB Cycle-Accurate Instruction Set Simulator MicroBlaze Processor: XMD • Three ways to debug MicroBlaze processor code: • OPB JTAG UART core • Intrusive: requires xmdstub software • OPB UART core • Intrusive: requires xmdstub software • OPB MDM core • Non-intrusive: hardware interface Tcl/Terminal Interface GDB Remote Protocol Host Software Host Software mb-gdb XMD (TCP/IP) JTAG UART JTAG JTAG UART UART MDM OPB Bus MicroBlaze
MicroBlaze Processor: XMD • MicroBlaze processor stub target (xmdstub) • User programs can be downloaded or executed directly from mb-gdb • To debug programs on the hardware by using xmdstub: 1. A JTAG UART or a UART must be included in the hardware system 2. A JTAG UART or a UART must be specified as the DEBUG_PERIPHERAL 3. The xmdstub executable must be included in the MicroBlaze processor’s local memory at system startup • Sample session of XMD with a hardware stub target • XMD% mbconnect stub -comm jtag -posit 2 • Connect to a MicroBlaze processor target via a stub, using JTAC communication, and an FPGA which is second in the JTAG chain
MicroBlaze Processor: XMD • MicroBlaze processor simulator target • mb-gdb and xmd can be used to debug programs on the cycle-accurate simulator built into XMD • Simulator target requirements • Programs should be compiled for debugging and should be linked with the startup code in crt0.o • Programs can have a maximum size of 64 KB only • Does not support the simulation of OPB peripherals • Sample session of XMD and GDB • XMD% mbconnect sim
MicroBlaze Processor: XMD • MicroBlaze processor MDM (hardware OPB_MDM debug core on-board) • The MDM target supports non-intrusive debugging by using: • Hardware breakpoints • Hardware single step • This removes the need to run xmdstub • This removes the requirement to have large memory • Sample session of XMD and GDB • XMD%mbconnect mdm
XMD Options • mbconnect <sim|stub|mdm> [options] • Simulator target options • -memsize size • xmdstub target options • -comm <serial|jtag> • -posit device position • -chain device count <list of BSDL files> • -port serial port • -baud baud rate
Outline • Software Development Kit • Debugging Tools • Debugging Using XPS • Debugging Using SDK • Simultaneous HW/SW Debug
1 2 Compile with the debugging option Download the bitstream A Debugging Sample This will go through the necessary steps, generate a bitstream file, and download the file
4 Start the XMD shell Start XMD 3 Set XMD Debug Options Set connection type and JTAG properties This opens a connection with the hardware, indicating whether the connecting ports and are enabled or not
6 5 A source code window displays Start Software Debugger Start Software Debugger If there are more than one application in the project then the tools will provide choice to select an application Change the code window display from SOURCE to MIXED to show C and assembly code
7 A window displaying C and assembly code 8 Select the target as Remote/TCP: XMD Software Debugger Connect Enter the port number that was displayed when connecting to the target
11 9 When a breakpoint is encountered, the debugger stops Set any breakpoints as necessary 12 10 Click the Run button View the necessary windows Debug Program Exit the debugger by typing quit in the console window
Outline • Software Development Kit • Debugging Tools • Debugging Using XPS • Debugging Using SDK • Simultaneous HW/SW Debug
Eclipse CDT auto-launched powerpc-eabi-gdb (or) mb-gdb gdb remote protocol XMD auto-launched Xilinx custom graphical debug interface JTAG / XMD protocol Debugging Using SDK
SDK Debug Perspective The stack frame for target threads that you are debugging. Each thread in your program is represented as a node in the tree Variables, Breakpoints, and Registers views allow for viewing and real-time interaction with the view contents for more powerful debugging potential C/C++ editor highlights the location of the execution pointer, along with allowing the setting of breakpoints Code outline and disassembly view provide compiler level insight to what is occurring in the running source Console view lists output information 1 1 2 2 3 3 4 4 5 5
Debugging in XPS vs SDK • Debugging in XPS • Download bitstream from XPS • Launch XMD • Provide Target Connection Options • Launch GDB (Insight GUI) • Set GDB Server connection port in GDB • Download program • Begin Debugging • Debugging in SDK • Download bitstream from XPS • Launch XMD • Provide Target Connection Options • Launch GDB (Insight GUI) • Set GDB Server connection port in GDB • Download program • Begin Debugging
Knowledge Check • What is the XMD command line used to connect to a MicroBlaze processor core via JTAG? • What is the advantage of using MDM over a JTAG UART? • Into what parts of the design do debuggers provide visibility?
Answers • What is the XMD command line used to connect to a MicroBlaze processor core via JTAG? • XMD% mbconnect stub -comm jtag -posit 2 • What is the advantage of using MDM over a JTAG UART? • Non-intrusive • Less memory required • Into what parts of the design do debuggers provide visibility? • Registers • Memory • Stack • Variables • Expressions
Knowledge Check • Describe XPS-SDK flow
Answers • Describe XPS-SDK flow • Using XPS, design the embedded system hardware platform and specify the software platform settings (libraries, device drivers, etc.) • Launch SDK, create a software application project, and point to the XPS project containing the embedded system platform • Using SDK, develop and compile applications for the selected embedded system • Using SDK, download the software executable to the target device to debug and profile your software application. (Use XPS or iMPACT tools to first download the hardware platform bitstream to the FPGA device) • In XPS, point to the software executable created in SDK and merge it into the FPGA bitstream for production use
Where Can I Learn More? • Tool documentation • Embedded System Tools GuideGNU Compiler Tools • Embedded System Tools GuideGNU Debugger • Embedded System Tools GuideXilinx Microprocessor Debugger • Xilinx Platform Studio SDK Online Documentation • Support Website • EDK Website: www.xilinx.com/edk
Outline • Software Development Kit • Debugging Tools • Debugging Using XPS • Debugging Using SDK • Simultaneous HW/SW Debug
MDM IBA IBA Simultaneous HW/SW Debug • ChipScope™ Pro PLB & IBA cores in target • ChipScope Pro Analyzer on host • GDB debugger on host • XMD supports simultaneous access over Xilinx parallel cables • PLB/OPB IBA instantiation in XPS • Treated like the peripheral cores Minimal skid-by as cross-triggering is done on chip between IBA cores and PPC and MicroBlaze™ debug interfaces Set breakpoint in GDB: when hit → triggers the ChipScope tool Set trigger in ChipScope: when hit → halts CPU and debugger stops
Active trigger when addr bus = 0xC200 Trigger out signal from IBA to CPU debug halt signal in XMD Xilinx parallel cable Simultaneous HW/SW Debug