Download
1 / 66
660 likes | 668 Views
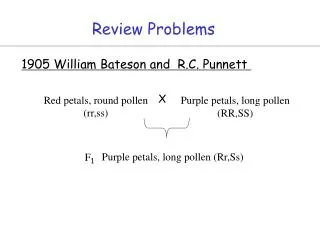
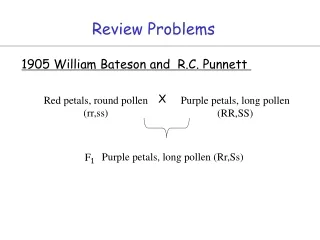
More review problems for OM. 13. What are differences between the common transmitted (or reflected) OM and polarized OM? 14. Can a polarized OM be used to determine the orientation (or optical axis) of an anisotropic single crystal? State your reasoning.

E N D
More review problems for OM 13. What are differences between the common transmitted (or reflected) OM and polarized OM? 14. Can a polarized OM be used to determine the orientation (or optical axis) of an anisotropic single crystal? State your reasoning. 15. Can you see something from eyepiece lens when an isotropic crystal is on the sample stage of a polarized OM? Why or why not?
(SEM) Lecture-4 Scanning Electron Microscopy • What is SEM? • Working principles of SEM • Major components and their functions • Electron beam - specimen interactions • Interaction volume and escape volume • Magnification, resolution, depth of field and image contrast • Energy Dispersive X-ray Spectroscopy (EDS) • Wavelength Dispersive X-ray Spectroscopy (WDS) • Orientation Imaging Microscopy (OIM) • X-ray Fluorescence (XRF) http://www.mse.iastate.edu/microscopy http://www.youtube.com/watch?v=KYNknR-e5IU to 2:40 Introduction http://virtual.itg.uiuc.edu/training/EM_tutorial http://science.howstuffworks.com/scanning-electron-microscope.htm/printable
Comparison of OM,TEM and SEM Probe Source of electrons Light source Condenser Magnetic lenses Specimen Objective Specimen Projector CRT Eyepiece Cathode Ray Tube detector OM SEM TEM Principal features of an optical microscope, a transmission electron microscope and a scanning electron microscope, drawn to emphasize the similarities of overall design. https://www.youtube.com/watch?v=b4WOsYktdn4 comparing microscopes to 0:12
Optical Microscopy (OM ) vs Scanning Electron Microscopy (SEM) 25mm radiolarian OM SEM Small depth of field Low resolution Large depth of field High resolution
http://virtual.itg.uiuc.edu/training/EM_tutorial What is SEM Column SEM is designed for direct studying of the surfaces of solid objects Sample Chamber Scanning electron microscope (SEM) is a microscope that uses electrons rather than light to form an image. There are many advantages to using the SEM instead of a OM. https://www.youtube.com/watch?v=sFSFpXdAiAM http://www.youtube.com/watch?v=lrXMIghANbg How a SEM works ~1:20-2:10 http://www.youtube.com/watch?v=SaaVaILUObg Operation of SEM
Advantages of Using SEM over OM Magnification Depth of Field Resolution OM 4x – 1000x 15.5mm – 0.19mm ~ 0.2mm SEM 10x – 3000000x 4mm – 0.4mm 1-10nm The SEM has a large depth of field, which allows a large amount of the sample to be in focus at one time and produces an image that is a good representation of the three-dimensional sample. The SEM also produces images of high resolution, which means that closely features can be examined at a high magnification. The combination of higher magnification, larger depth of field, greater resolution and compositional and crystallographic information makes the SEM one of the most heavily used instruments in research areas and industries, especially in semiconductor industry.
Scanning Electron Microscope– a Totally Different Imaging Concept • Instead of using the full-field image, a point-to-point measurement strategy is used. • High energy electron beam is used to excite the specimen and the signals are collected and analyzed so that an image can be constructed. • The signals carry topological, chemical and crystallographic information, respectively, of the samples surface. https://www.youtube.com/watch?v=VWxYsZPtTsI at~4:18-4:38 http://www.youtube.com/watch?v=lrXMIghANbg at~4:16-4:42 https://www.youtube.com/watch?v=nPskvGJKtDI
Main Applications • Topography The surface features of an object and its texture (hardness, reflectivity… etc.) • Morphology The shape and size of the particles making up the object (strength, defects in IC and chips...etc.) • Composition The elements and compounds that the object is composed of and the relative amounts of them (melting point, reactivity, hardness...etc.) • Crystallographic Information How the grains are arranged in the object (conductivity, electrical properties, strength...etc.)
http://virtual.itg.uiuc.edu/training/EM_tutorial A Look Inside the Column Column http://www.youtube.com/watch?v=c7EVTnVHN-s at~1:10-2:10 inside the column
A more detailed look inside http://www.youtube.com/watch?v=sFSFpXdAiAM <72o Electron Gun e- beam https://www.youtube.com/watch?v=Mr9-1Sz_CK0 at~1:06-2:40 Source: L. Reimer, “Scanning Electron Microscope”, 2nd Ed., Springer-Verlag, 1998, p.2 https://www.youtube.com/watch?v=GY9lfO-tVfE at~2:38-4:45 - beam convergence
What is SEM? • Working principles of SEM • Major components and their functions
How an Electron Beam is Produced? • Electron guns are used to produce a fine, controlled beam of electrons which are then focused at the specimen surface. • The electron guns may either bethermionic gunorfield-emission gun
Electron beam Source LaB6 w W or LaB6 Filament Thermionic or Field Emission Gun http://www.youtube.com/watch?v=fxEVsnZT8L8 at ~2:10-2:20 http://www.youtube.com/watch?v=VWxYsZPtTsI at ~1:05-1:40 thermionic gun
http://www.matter.org.uk/tem/electron_gun/electron_sources.htmhttp://www.matter.org.uk/tem/electron_gun/electron_sources.htm http://www.matter.org.uk/tem/electron_gun/electron_gun_simulation.htm Thermionic Emission Gun • A tungsten filament heated by DC to approximately 2700K or LaB6 rod heated to around 2000K • A vacuum of 10-3 Pa (10-4 Pa for LaB6) is needed to prevent oxidation of the filament • Electrons “boil off” from the tip of the filament • Electrons are accelerated by an acceleration voltage of 1-50kV - + http://www.youtube.com/watch?v=ZIJ1jI1xDhY Electron gun detail
Field Emission Gun • The tip of a tungsten needle is made very sharp (radius < 0.1 m) • The electric field at the tip is very strong (> 107 V/cm) due to the sharp point effect • Electrons are pulled out from the tip by the strong electric field • Ultra-high vacuum (better than 10-6 Pa) is needed to avoid ion bombardment to the tip from the residual gas. • Electron probe diameter < 1 nm is possible http://www.matter.org.uk/tem/electron_gun/electron_sources.htm
Source of Electrons E: >10MV/cm Thermionic Gun T: ~1500oC W Filament (5-50mm) (5nm) W and LaB6 Cold- and thermal FEG Electron Gun Properties Source BrightnessStability(%) SizeEnergy spread Vacuum W 3X10⁵ ~1 50mm 3.0(eV) 10-5 (t ) LaB6 3x10⁶ ~2 5mm 1.5 10-6 C-FEG 109 ~5 5nm 0.3 10-10 T-FEG 109 <1 20nm 0.7 10-9 Brightness – beam current density per unit solid angle
Why Need a Vacuum? When a SEM is used, the electron-optical column and sample chamber must always be at a vacuum. • If the column is in a gas filled environment, electrons will be scattered by gas molecules which would lead to reduction of the beam intensity and stability. 2. Other gas molecules, which could come from the sample or the microscope itself, could form compounds and condense on the sample. This would lower the contrast and obscure detail in the image. http://virtual.itg.uiuc.edu/training/EM_tutorial external http://www.youtube.com/watch?v=c7EVTnVHN-s at ~4:50-5:25 http://www.mse.iastate.edu/research/laboratories/sem/microscopy/how-does-the-sem-work/high-school/the-sem-vacuum/ SEM Vacuum
Major components and their functions Magnetic Lenses • Condenser lens – focusing controls the spot size and convergence () of the electron beam which impinges on the sample. • Objective lens – final probe forming determines the final spot size of the electron beam, i.e., the resolution of a SEM. http://www.youtube.com/watch?v=lrXMIghANbg at~1:30-1:53 http://www.youtube.com/watch?v=VWxYsZPtTsI at~0:32-1:02 http://www.matter.org.uk/tem/lenses/simulation_of_condenser_system.htm
http://www.youtube.com/watch?v=G9Glw3BUTAQ Magnetic field in a solenoid http://www.youtube.com/watch?v=a2_wUDBl-g8 e- in a magnetic field https://www.youtube.com/watch?v=fwiKRis145E to~1:15 and at~3:08-4:15 F=-e(vxB) How Is Electron Beam Focused? http://www.matter.org.uk/tem/lenses/electromagnetic_lenses.htm Magnetic lens (solenoid) (Beam diameter) A magnetic lens is a solenoid designed to produce a specific magnetic flux distribution. p F = -e(v x B) q Lens formula: 1/f = 1/p + 1/q M = q/p Demagnification: https://www.youtube.com/watch?v=sCYX_XQgnSA&feature=related 6:13-6:23 f Bo2 Magnetic lens f can be adjusted by changing Bo, i.e., changing the current through coil. Bo - magnetic field http://www.youtube.com/watch?v=3McFA40nP0A Magnetic deflection of e- beam at~0:20-1:50
Lens formula and magnification Objective lens ho f f hi O i -Inverted image I1 1 1 1 _ = _ + _ Lens Formula f-focal length (distance) O-distance of object from lens i-distance of image from lens f Oi i Magnification by objective hi mo = = ho O http://www.youtube.com/watch?v=-k1NNIOzjFo&feature=related at~3:00-3:40 http://micro.magnet.fsu.edu/primer/java/lenses/converginglenses/index.html
The Condenser Lens • For a thermionic gun, the diameter of the first cross-over point ~20-50µm • If we want to focus the beam to a size < 10 nm on the specimen surface, the magnification should be ~1/5000, which is not easily attained with one lens (say, the objective lens) only. • Therefore, condenser lenses are added to demagnify the cross-over points.
http://www.matter.org.uk/tem/lenses/simulation_of_condenser_system.htm change of f The Condenser Lens Demagnification: M = f/L
The Objective Lens • The objective lens controls the final focusof the electron beam by changing the magnetic field strength • The cross-over image is finally demagnified to an ~10nm beam spot which carries a beam current of approximately 10-9-10-12 A.
The Objective Lens – Aperture Electron beam • Since the electrons coming from the electron gun have spread in kinetic energies and directions of movement, they may not be focused to the same plane to form a sharp spot. • By inserting an aperture, the stray electrons are blocked and the remaining narrow beam will come to a narrow Objective lens Wide aperture Narrow aperture Narrow disc of least confusion Wide disc of least confusion Large beam diameter striking specimen Small beam diameter striking specimen Better resolution “Disc of Least Confusion” https://www.youtube.com/watch?v=E85FZ7WLvao http://www.matter.org.uk/tem/lenses/simulation_of_condenser_system.htm aperture
A Look Inside the Column Column Objective aperture A disc of metal
http://www.matter.org.uk/tem/lenses/second_condenser_lens.htmhttp://www.matter.org.uk/tem/lenses/second_condenser_lens.htm The Objective Lens - Focusing Objective lens • By changing the current in the objective lens, the magnetic field strength changes and therefore the focal length of the objective lens is changed. Out of focus in focus out of focus lens current lens current lens current too strong optimized too weak Over-focused Focused Under-focused
The Scan Coil and Raster Pattern • Two sets of coils are used for scanning the electron beam across the specimen surface in a raster pattern similar to that on a TV screen. • This effectively samples the specimen surface point by point over the scanned area. X-direction scanning coil Holizontal line scan Blanking y-direction scanning coil Objective lens specimen http://www.youtube.com/watch?v=lrXMIghANbg at ~4:12
http://www.youtube.com/watch?v=VWxYsZPtTsI at~4:45 http://virtual.itg.uiuc.edu/training/EM_tutorial internal Electron Detectors and Sample Stage Objective lens Sample stage https://www.youtube.com/watch?v=Mr9-1Sz_CK0 at~2:20-2:30
Scanning Electron Microscopy (SEM) • What is SEM? • Working principles of SEM • Major components and their functions • Electron beam - specimen interactions • Interaction volume and escape volume • Magnification, resolution, depth of field and image contrast • Energy Dispersive X-ray Spectroscopy (EDS) • Wavelength Dispersive X-ray Spectroscopy (WDS) • Orientation Imaging Microscopy (OIM) • X-ray Fluorescence (XRF)
Electron Beam and Specimen Interactions Sources of Image Information Electron/Specimen Interactions (1-50KeV) Electron Beam Induced Current (EBIC) https://www.youtube.com/watch?v=F9qwfYwwCRM at~0.58-1:38 http://www.youtube.com/watch?v=Mr9-1Sz_CK0 at~2:30-2:42
http://www.youtube.com/watch?v=Mr9-1Sz_CK0 at~2:52-3:52 https://www.youtube.com/watch?v=F9qwfYwwCRM at~0:58-1:14 Secondary Electrons (SE) Produced by inelastic interactions of high energy electrons with valence (or conduction) electrons of atoms in the specimen, causing the ejection of the electrons from the atoms. These ejected electrons with energy less than 50eV are termed "secondary electrons". Each incident electron can produce several secondary electrons. Primary SE yield: d=nSE/nB independent of Z d decreases with increasing beam energy and increases with decreasing glancing angle of incident beam BaTiO3 Production of SE is very topography related. Due to their low energy, only SE that are very near the surface (<10nm) can exit the sample and be examined (small escape depth). Growthstep 5m SE image Z – atomic number
Topographical Contrast Everhart-Thornley SE Detector Bright lens polepiece e- SE Scintillator light pipe PMT Dark sample Quartz window Faraday cage +10kV +200V Photomultiplier tube Topographic contrast arises because SE generation depend on the angle of incidence between the beam and sample.Thus local variations in the angle of the surface to the beam (roughness) affects the numbers of electrons leaving from point to point. The resulting “topographic contrast” is a function of the physical shape of the specimen. http://www.youtube.com/watch?v=lrXMIghANbg at ~2:10-3:30 (3:09~3:18) https://www.youtube.com/watch?v=GY9lfO-tVfE at~4:35-6:00 http://www.youtube.com/watch?v=VWxYsZPtTsI at~3:00-3:20
Everhart-Thornley SE DetectorSystem Solid angle of collection Both SE and B electrons can be detected, but the geometric collection efficiency for B electrons is low, about 1-10%, while for SE electrons it is high, often 50% or more.
http://www.youtube.com/watch?v=Mr9-1Sz_CK0 at~3:52-4:26 Backscattered Electrons (BSE) Primary BSE image from flat surface of an Al (Z=13) and Cu (Z=29) alloy BSE are produced by elastic interactions of beam electrons with nuclei of atoms in the specimen and they have high energy and large escape depth. BSE yield: h=nBS/nB ~ function of atomic number, Z BSE images show characteristics of atomic number contrast, i.e., high average Z appear brighter than those of low average Z. h increases with tilt. http://www.youtube.com/watch?v=VWxYsZPtTsI at ~3:20-3:35 https://www.youtube.com/watch?v=F9qwfYwwCRM at~1:14-1:34
Semiconductor Detector for Backscattered Electrons High energy electrons produce electron-hole pairs (charge carriers) in the semiconductor, and generate a current pulse under an applied potential. A and B are a paired semiconductor detectors https://www.youtube.com/watch?v=F9qwfYwwCRM at~4:25-4:50
Interaction Volume: I e- The incident electrons do not go along a straight line in the specimen, but a zig-zag path instead. Monte Carlo simulations of 100 electron trajectories
Interaction Volume: II The penetration or, more precisely, the interaction volume depends on the acceleration voltage (energy of electron) and the atomic number of the specimen and e- beam size
Escape Volume of Various Signals • The incident electrons interact with specimen atoms along their path in the specimen and generate various signals. • Owing to the difference in energy of these signals, their ‘penetration depths’ are different • Therefore different signal observable on the specimen surface comes from different parts of the interaction volume • The volume responsible for the respective signal is called the escape volume of that signal.
Escape Volumes of Various Signals If the diameter of primary electron beam is ~5nm - Dimensions of escape zone of • Secondary electron: diameter~10nm; depth~10nm • Backscattered electron: diameter~1m; depth~1m • X-ray: from the whole interaction volume, i.e., ~5m in diameter and depth http://www.youtube.com/watch?v=VWxYsZPtTsI at ~3:38-4:10
Electron Interaction Volume Pear shape 5mm a b a.Schematic illustration of electron beam interaction in Ni b.Electron interaction volume in polymethylmethacrylate (plastic-a low Z matrix) is indirectly revealed by etching
Primary Escape Volumes of Various Signals SE Lost SE BE Lost BE X-ray
Lecture-3 SEM • What is SEM? • Working principles of SEM • Major components and their functions • Electron beam - specimen interactions • Interaction volume and escape volume • Magnification, resolution, depth of field and image contrast • Energy Dispersive X-ray Spectroscopy (EDS) • Wavelength Dispersive X-ray Spectroscopy (WDS) • Orientation Imaging Microscopy (OIM) • X-ray Fluorescence (XRF) http://www.youtube.com/watch?v=sFSFpXdAiAM
http://www.youtube.com/watch?v=VWxYsZPtTsI at ~4:18-4:45 Image Formation & Magnification in SEM M= C/x A 10cm e- beam Detector 10cm Amplifier A Beam is scanned over specimen in a raster pattern in synchronization with beam in CRT. Intensity at A on CRT is proportional to signal detected from A on specimen and signal is modulated by amplifier. http://www.youtube.com/watch?v=lrXMIghANbg at ~4:10-4:40
https://www.youtube.com/watch?v=Mr9-1Sz_CK0 at~11:45-11:55 Magnification e- x Low M Large x 40mm High M small x 7mm 1.2mm 15000x 2500x The magnification is simply the ratio of the length of the scan C on the Cathode Ray Tube (CRT) to the length of the scan x on the specimen. For a CRT screen that is 10 cm square: M= C/x = 10cm/x Increasing M is achieved by decreasing x. M x M x 100 1 mm 10000 10 mm 1000 100 mm 100000 1 mm
Image Magnification Example of a series of increasing magnification (spherical lead particles imaged in SE mode)
Resolution Limitations Ultimate resolution obtainable in an SEM image can be limited by: • Electron Optical limitations Diffraction: dd=1.22/ for a 20-keV beam, =0.0087nmand =5x10⁻³ dd=2.1nm Chromatic and spherical aberrations: dmin=1.29l3/4 Cs1/4 A SEM fitted with an FEG has an achievable resolution of ~1.0nm at 30 kV due to smaller Cs (~20mm) and l. • Specimen Contrast Limitations Contrast dmin 1.0 2.3nm 0.5 4.6nm 0.1 23nm 0.01 230nm 3. Sampling Volume Limitations (Escape volume) NA=nsin ~ 500nm dmin = 0.61l/NA for OM http://www.youtube.com/watch?v=SVK4OkUK0Yw at~1:47-3:07 Cs – coefficient of spherical aberration of lens (~mm)
How Fine Can We See with SEM? • If we can scan an area with width 10 nm (10,000,000×) we may actually see atoms!! But, can we? • Image on the CRT consists of spots called pixels (e.g. your PC screen displays 1024×768 pixels of ~0.25mm pitch) which are the basic units in the image. • You cannot have details finer than one pixel! Pixel - In digital imaging, a pixel (picture element) is a physical point in a raster image, or the smallest addressable element in a display device; so it is the smallest controllable element of a picture represented on the screen. http://en.wikipedia.org/wiki/Pixel
Resolution of Images: I • Assume that there the screen can display 1000 pixels/(raster line), then you can imagine that there are 1000 pixels on each raster line on the specimen. • The resolution is the pixel diameter on specimen surface. P=D/Mag = 100um/Mag Mag P(m) Mag P(nm) 10x 10 10kx 10 1kx 0.1 100kx 1 P-pixel diameter on specimen surface D-pixel diameter on CRT, Mag-magnification