1 / 15

P7-3

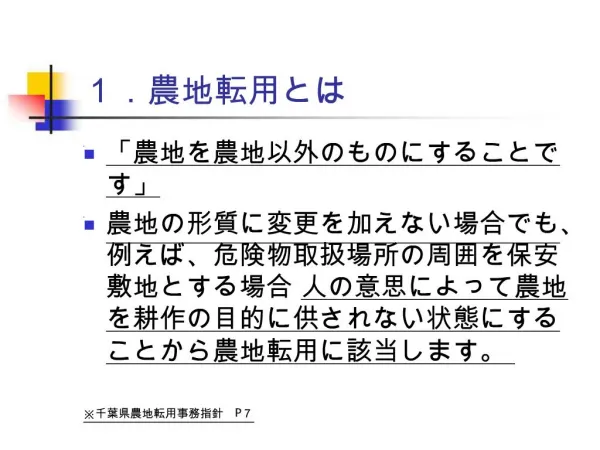
P7-3. Average Cost. Average Cost. FIFO. FIFO. FIFO. L IFO. L IFO. L IFO. Specific Identification. Specific Identification. Specific Identification. b. Higher Pretax Income FIFO (higher gross profit + assume profitable) Higher EPS

boyce
Download Presentation

P7-3

An Image/Link below is provided (as is) to download presentation Download Policy: Content on the Website is provided to you AS IS for your information and personal use and may not be sold / licensed / shared on other websites without getting consent from its author. Content is provided to you AS IS for your information and personal use only. Download presentation by click this link. While downloading, if for some reason you are not able to download a presentation, the publisher may have deleted the file from their server. During download, if you can't get a presentation, the file might be deleted by the publisher.

E N D

Presentation Transcript


  1. P7-3

  2. Average Cost

  3. Average Cost

  4. FIFO

  5. FIFO

  6. FIFO

  7. LIFO

  8. LIFO

  9. LIFO

  10. Specific Identification

  11. Specific Identification

  12. Specific Identification

  13. b • Higher Pretax Income • FIFO (higher gross profit + assume profitable) • Higher EPS • = Net income / average outstanding shares of common stock • Higher pretax income = higher net income (assuming taxes is fixed percentage of income) • FIFO

  14. c • Lower income tax expense • LIFO • lower pretax income, and 30% average tax rate • Comparison • Assuming other expenses are $1000 • FIFO: $6700 - $1000 = $5700  30% of $5700 = $1710 • LIFO: $5880 - $1000 = $4880  30% of $4880 = $1464

  15. d • Favourable cash flow • FIFO • Higher total ending balance

More Related