Download
1 / 28
280 likes | 672 Views
Infrared Imaging and Spectroscopic Phenomenology of the Turin Shroud. Joseph S. Accetta, Ph.D. Georgia Tech Research Institute Georgia Institute of Technology Atlanta, GA 30332-0857. Outline. Introduction and theory Review of the 1978 Results Spectroscopy Thermal Infrared

E N D
Infrared Imaging and Spectroscopic Phenomenology of the Turin Shroud Joseph S. Accetta, Ph.D. Georgia Tech Research Institute Georgia Institute of Technology Atlanta, GA 30332-0857
Outline • Introduction and theory • Review of the 1978 Results • Spectroscopy • Thermal Infrared • Spectroscopy of Various Image Formation Theories • Future Possibilities • Conclusions
Objectives of the 1978 Infrared Experiments • Investigate on a “first look” basis the IR imagery of the cloth • Are the image attributes in the LWIR consistent with the visible image • What are the characteristics of the LWIR emissivity • Determine the chemical composition or the presence of certain chemical groups via IR reflectance spectroscopy in the MWIR and LWIR on the Shroud • To affirm or deny certain informed speculations on the image formation processes • To confirm the presence of other materials
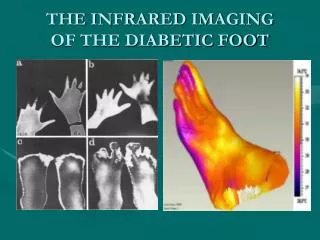
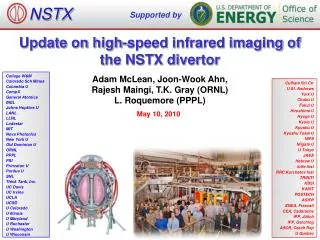
Infrared Imaging Summary • IR imaging attempted in 3-5um and 8-14 um bands. • No images observed in either band without illumination. • With external illumination (dual 1500 watt photolamps) no image observed in the 3-5 um • With external illumination, considerable detail observed in the 8-14um band. Most visible features were observed in IR with greater or lesser degrees of fidelity. • No significant new information revealed
Thermal Infrared Imagery Visible Images 8-14 μm, range 1.75°C, Sensitivity ~ .1°C Δε ~ 2%
Long Wave IR (LWIR) Phenomenology • All bodies radiate energy. Bodies at room temperature conveniently radiate around 10um in the LWIR • In the LWIR, 2 factors are responsible for image contrast, temperature and emissivity: E = εσT4 • Emissivity is the property that is equivalent to radiative efficiency and in an imaging context roughly equivalent to image density or reflectivity. • Differences in emissivity can be attributed to material/chemical changes or surface properties
Comparison of Visible and Thermal Infrared Imagery Charcoal Drawing and Simulated IR Image IR Image of a Classical Oil Painting Human Body Thermal Infrared Images Outdoor Natural Scene
Analysis of IR Imagery • Crude correlation between visible image density and infrared emissivity - not always the case • Explanations for Observed Contrast: • Changes in emissivity • Changes in the density of fibers of a given emissivity (fibers/mm2) similar to halftone process • Combination of the two • Both produce same visual/infrared effect and may exhibit the so called 3d property (maybe an unintended consequence). • The specific mechanism may have a significant impact on theorizing possible image formation processes Contrast Process Halftone Process
Image Recognition Attributes(artistic license taken with all) • Shape • Lighting- Color and Direction • The Reflectance Distribution (BRDF) • Most surfaces will yield apparent contrast depending on their orientation with respect to the observer and the lighting direction • Shadows • Necessary ingredient in realistic images-difficult to create photographic images without some shadowing, leads to distortion in a 3-d representation of conventional imagery • Color • Relative Contrast • Perspective
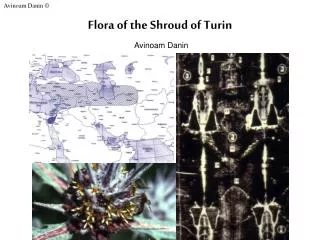
The 3-d Nature of the Image • The 3-d nature of the cloth is revealing. The 3-d fidelity of the image implies little artistic bent. All of the shadowing and other attributes of a conventional interpretation are missing. • Equivalent to the creation of an image devoid of shadows and directional lighting only containing the spatial reflectance distribution characteristic. Concave surface dark in normal presentation Light Source Convex surface light in normal presentation In the Shroud these presentations are reversed
3-D Property Shadowing is apparent in all of these images except perhaps the leftmost one. None of the other images would render a 3-d reproduction with a vp-8 or similar instrument.
Conclusions • Interpretation of the 3-d effect not trivial. MTF and film linearity are factors. • IR image displays roughly the same features as the visible image • Speculate that the IR image would exhibit pseudo 3-d properties as well • Maybe little more than an artifact of the image formation process
Spectroscopic Investigations • Offers both destructive and non-destructive means for identification of the chemistry associated with the various features including: • Spectra of the base cloth. Characteristic linen features plus contamination • Image areas • Scorch areas • Blood areas • All are amenable to qualitative analysis via spectroscopy
Identification of Chemical Compounds and Groups • Characteristic Bond Frequencies • Appeal to Spectral Libraries
Phenomenology of a Remote Spectroscopic Measurement Background Radiation Atmospheric Absorption E Spectrometer Blackbody Illumination Source λ
1978 Results • Equipment failures resulted in very poor statistical sampling of reflectance spectra in both bands (3-5um and 8-14um) • Atmospherics played a part in the results • Large uncertainty in spectral noise precluded more definitive analysis • Re-analysis attempted
36% Solution of H2SO4 on Linen 3 4 5 8 9 10 11 12 13 14 15
Whole Blood on Linen 8 9 10 11 12 13 14 15
Lemon Juice on Linen 8 9 10 11 12 13 14 15
13% NaCl solution on Linen 3 4 5 8 9 10 11 12 13 14 15
Thermal Scorch on Linen 3 4 5 8 9 10 11 12 13 14 15
New Possibilities • Spectroscopic instrumentation now exists to determine the bonds if not the chemical composition of image features • Destructively-probably • Non-destructively-possibly • Recommend a research program to examine the bounds of spectroscopic non-destructive testing on a microscopic or macroscopic level.