Download
1 / 4
60 likes | 315 Views
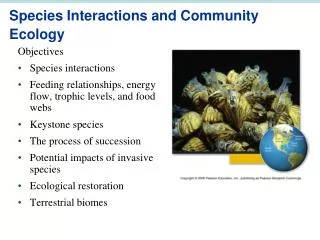
Food Webs & Energy Pyramids. https://encrypted-tbn2.gstatic.com/images?q=tbn:ANd9GcSIzVAw0xmKeDcew5lLt01d0EcInJ1yC3TdDa0aIeyawNzzdyZhhQ. Trophic Levels. One layer in the feeding relationship of an ecosystem.

E N D
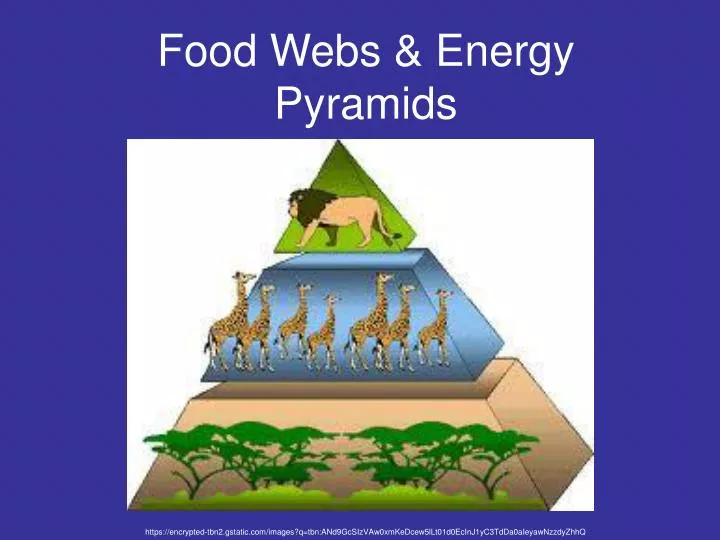
Food Webs & Energy Pyramids https://encrypted-tbn2.gstatic.com/images?q=tbn:ANd9GcSIzVAw0xmKeDcew5lLt01d0EcInJ1yC3TdDa0aIeyawNzzdyZhhQ
Trophic Levels • One layer in the feeding relationship of an ecosystem http://cleangreenenergyzone.com/wp-content/uploads/2011/03/energy-pyramid-ecosystem.jpg
Energy Pyramids • Show relative biomass at each trophic level in an ecosystem. http://www.edquest.ca/notesimages/foodpyramid.gif
Example of an Energy Pyramid 1 pound MAN 10 pounds FOXES 100 pounds RABBITS 1000 pounds of GRASS MAN 0.1% Energy Lost during conversion to heat, waste…. 10% 100 % of the sun’s energy FOX 90% 1% 10% RABBIT 90% 10% 10% GRASS 90% - The decreasing size of the pyramid shows that each level of the pyramid has a smaller and smaller mass of those organisms.