Download

1 / 31
310 likes | 438 Views
Class 5. Please bring your Research Methods paper to the front table and make sure it has your name on it. Class Agenda. Dale Carnegie Speeches Executive Summary Mistakes Findings Advice Coding Open Ended Responses.

E N D
Class 5 Please bring your Research Methods paper to the front table and make sure it has your name on it.
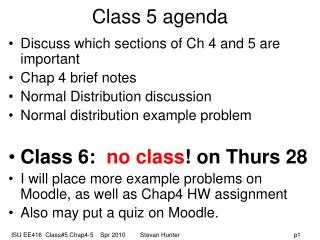
Class Agenda • Dale Carnegie Speeches • Executive Summary Mistakes • Findings Advice • Coding Open Ended Responses
Nonprofit & Government Career FairFriday, February 28, 201411:00 a.m. - 2:00 p.m.Panasci Lounge, Schine*free to attend*
Format of Ex. Summary • Use Times New Roman- Size 12 • WATCH YOUR SPACING • Finding numbers should be left justified • No demographics in findings unless you are profiling clients • No decimals in percentages
Using % When Reporting Sample Size • Describe sample as percent of target population in Ex. Summary • E.g., With a target population of 100, 10 surveys (10%) were collected. COPLIN WILL BE FURIOUS IF YOU DON’T DO THIS
Writing • Learn how to use commas and avoid ; or : as conjunctions • Data were, not was • No repetition • Say “mail” survey; not “mailing survey” or “mailed survey” • Avoid too much detail on methods in the Exec Summary • Put target population, sampling frame (if there is one) and sample in one sentence • Make sure reader knows how you got the data and include date(s) if records • Don’t get heavy into representativeness. Say either: • “The sample is likely to represent the target population because….” • “The sample may not represent the target population because…” (of its small size or differences in demographics between the sample and target population)
More Dont’s • Put demographics in Ex. Summary Findings • Confuse absolute numbers with rates • Incorrectly using the word “random” • Use the plural to refer to your agency like “they are trying to improve their program” • USE UTILIZE
WORDS YOU NEVER USE In this Report • Assess and evaluate to describe your study. You are reporting not making judgments. • Effective and efficient. You can’t possibly know that from your data. • Don’t say “respondents are unhappy.” Say “respondents said they were unhappy” You only know what they said.
If your executive summary says “See Me” you must make an appointment with Coplin BEFORE class next week.
Findings and Analysis • Some general principles in conducting your data analysis and developing graphs for your findings.
Decide Interval, Ordinal, Nominal • Interval—Variables continuous numbers like weight • Ordinal—Variables have categories that are ordered in some way • Nominal—Variables are unordered categories
Interval • Averages • Trend lines • Can be categorized for bar graphs
Nominal • Categories represent in bars must be ranked by percentages • Example: open ended responses or “check all that apply” questions The most frequently mentioned characteristic of the client was “friendly” (81%).
Ordinal • Bar graphs where the bars must be ranked according to the order of the categories. E.g., very dissatisfied, satisfied, neutral, satisfied, very dissatisfied • 60% of respondents said they were “very dissatisfied” or “dissatisfied” with Enable’s services.
Step 2: Univariate or Bivariate Analysis? • “Uni” means one • Look at each variable separately--range, mean and Standard Deviation if it is a number • Frequencies if it is nominal • Most of your findings will be univariate • Grouping interval data to make it ordinal –creating ranges
Univariate Analysis for Nominal Variables • Rank frequencies in percentages from high to low • Ex. demographic, Female 51% Male 49% • Ex. Number of People in Programs 1-3 Program C—43% Program A—38% Program B-19%
What about Bivariate Analysis? • Bi means two • Involves looking at 2 variables • Example: Does gender relate to whether respondents like or dislike the program? • 3 ways to display this information
Contingency Tables • Method to see if one variable is correlated with another. • Will be discussed more in next classes
Coding Open-Ended Responses • List actual responses • Aggregate into categories • Graph categories • Include category name with actual responses listed below in appendix (sample on next slide)
Categories for Open-Ended Exercise Salary and benefits Working conditions – facility Supervisors Safety and health Office complaints
Raw Responses: Change final paper Eliminate disorderly students Screen clients better Require clients to have survey Eliminate smaller papers Change final paper Make Clients accountable Eliminate final paper Don’t do faculty contact Change professor Aggregated Responses: Alter Assignments 5 Change final paper (3) Eliminate smaller papers Don’t do faculty contact Improve Clients 3 Screen Clients better Require clients to have survey Make clients accountable Other 2 Eliminate disorderly students Change professor How would you improve PAF 315?
How would you improve PAF 315? 1. The most frequent response for how to improve PAF315 was “alter assignments” at 50%. Aggregated Responses: Alter Assignments 5 Change final paper (3) Eliminate smaller papers Don’t do faculty contact Improve Clients 3 Screen Clients better Require clients to have survey Make clients accountable Other 2 Eliminate disorderly students Change professor Source: Study done by XYZ agency, 2004 Comment: Of the 10 respondents who gave specific ways to improve PAF 315, 3 respondents (17%) suggested to “change the final paper”. See Appendix II for complete list of responses.
Coding Open-Ended Questions • Complete worksheet • 3-5 categories • We’ll discuss as a class
Reminders • Due next class 2/19: • Formatted Report Shell (we will show you in training) • Due in 3 weeks 3/5: • Rough Draft
Dale Carnegie Next Week 2/19 • EjonaMurataj • Connor Wilson • Sarah Feiner • Elizabeth McMahon • Michelle Sczpanski • Benjamin Choe • Daniela Lopez • Marisa Rodriguez • Rebecca Zaccaria
Supervisor Meeting • Word Training • Report Format • Headers • Footers