Download
1 / 20
200 likes | 349 Views
Investment Modeling for Biofuels and Biochemicals. Lawrence D. Sullivan & Company, Inc. Larry Sullivan, Project Management Consultant Adjunct Faculty, Trident Technical College Carla M. Wood, Ph.D. Lawrence D. Sullivan & Company, Inc.

E N D
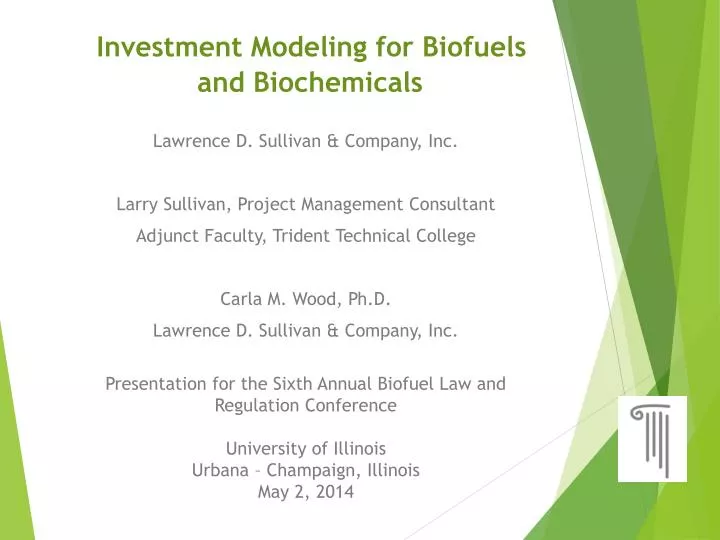
Investment Modeling for Biofuelsand Biochemicals Lawrence D. Sullivan & Company, Inc. Larry Sullivan, Project Management Consultant Adjunct Faculty, Trident Technical College Carla M. Wood, Ph.D. Lawrence D. Sullivan & Company, Inc. Presentation for the Sixth Annual Biofuel Law and Regulation Conference University of Illinois Urbana – Champaign, Illinois May 2, 2014
Lawrence D. Sullivan – Past & Present • 20 Years in Oil & Gas (Dresser, Imperial Chemical Industries & Conoco/Dupont) as Petroleum Engineer and Manager • Last 12 Years in Biofuels, Biomass, Biochemicals - Early Stage Firms • 15 Years Living and Working Outside the USA – SEAsia, Middle East, EU & Africa • Speaker at 25 Conferences –Beginning at 2004 Biotechnica • Advisor to Gerson Lehrman Group Clients as Top 2% Expert • Due Diligence for GLG Clients • Turner, Mason & Company - Oil Refiner Acquisitions of Stranded Biofuel Assets • Adjunct Faculty at Trident Technical College
Carla M. Wood, Ph.D. Academic Career • B.S., The Evergreen State College - Biochemistry • Ph.D., Texas A&M University – Biochemistry & Cell Biology • Post Doctorate, Baylor College of Medicine, Depts. of Cell Biology – Human DNA Repair, Cellular Transformation & Mutagenesis • Staff Scientist, NIH, National Institute on Aging, Molecular Genetics – Genes of Senescence, Stress Response, & DNA Damage • Research Assistant Professor, University of Minnesota – 1) Expression Analysis of Non-Receptor Protein Tyrosine Kinases in Childhood Leukemia 2) Biomarkers in Multiple Myeloma • Patent Law Technical Advisor, Merchant & Gould, LLC, Minneapolis & Seattle Consulting Career • Consultant at L. D. Sullivan & Co. Since 2004 (Owner Since 1998) • Advisors to Gerson Lehrman Group Clients - Top 2% Experts • Due Diligence for GLG Clients • Expert Witness
Outline of Presentation – Themes • What is the Capital Asset Pricing Model (CAPM) and who uses it? • Return on Capital Employed (ROCE) on investments in raw materials production (e.g., Extraction) • ROCE on the Basic Chemicals (generally has “mining” components) • ROCE on the conversion of raw materials to petrochemical intermediates (and Basic Chemicals as well as Seven Building Blocks) • Capital Investment Expectations and Conclusions • References and Sources: • www.bizstats.com • Measuring and Addressing Investment Risk in the Second-Generation Biofuels Industry. ICCT. December 2013. www.theicct.org Addresses conversion of raw materials • NexantThinking™ “Next Generation Biofeedstocks: Resources for Renewables” www.Nexant.com Addresses raw materials
Capital Asset Pricing ModelReturn on Capital Employed (ROCE) Formula: Terms: Return on Capital Employed (both equity and debt) or Equity Beta of 1.0 moves with markets Market Return is set by Investors Risk Free example is United Kingdom Perpetual Bonds ICCT reports that Beta on public biotech requires high ROCE for investment
The difference between return on assets and return on equity in a general sense is based on gross versus net profits. Assets usually represent the market price of durable goods such as real estate, automobiles, and heavy construction equipment, and businesses themselves or investments like bonds that hold their value over time. Equity, on the other hand, represents what the actual monetary value of something is after all outstanding debts and liens have been subtracted from it, and this can also include taxes that must be paid such as those on retirement accounts or annuities when they are cashed in. Both return on assets and return on equity calculations are often used in the investment community to ascertain what the value of a business is if it has to be liquidated, or how much built up value it has for determining a safe level of borrowing for business growth. More specifically, however, return on assets (ROA) and return on equity (ROE) are metrics that corporations use based off of company earnings or net income to determine if the company is producing what is considered a healthy profit and growth margin.
ROCE – Oil and Gas Extraction (2010)High Risk, High Rewards • Return on Sales 13.43% • Return on Assets 6.67% • Return on Net Worth 13.04% • Quick Ratio 1.08 • Current Ratio 1.38 • Inventory Turnover 34.40 Note: Oil prices in 2010 averaged $80/bbl (WTI - Cushing, OK) and natural gas was $4.48 per 1,000,000 cubic feet at the wellhead.
ROCE - Extraction Industries: Agriculture and Forestry (2010) • Return on Sales 7.81% • Return on Assets 8.30% • Return on Net Worth 19.41% • Quick Ratio 0.70 • Current Ratio 1.31 • Inventory Turnover 8.88 Note: Covers a Bizstats’ range (LLC, Inc., MLP) with Net Assets from $1 to $500,000 which would include farmer-owned cooperative societies (LLCs, Inc.), independent forestry owners and small time miners. Does not cover processors like ADM, Cargill, Bunge, etc. or Real Estate Investment Trusts in forestry, agriculture and mining like Plum Creek or Hancock.
ROCE - “Basic Chemicals” (2010) • Return on Sales 2.57% • Return on Assets 1.37% • Return on Net Worth 4.52% • Quick Ratio 0.74 • Current Ratio 1.08 • Inventory Turnover 9.96 Notes: Covers Bizstats data for both the chloro-alkali industry (NaCl, NaOH, Na, Cl, soda ash, bicarbonate, NaO) and the sulfur (H2SO4) from both synthetic to mining. Not petrochemicals or TiO2.
ROCE - Petroleum Refining (2010) • Return on Sales 6.14% • Return on Assets 3.83% • Return on Net Worth 9.34% • Quick Ratio 1.13 • Current Ratio 1.21 • Inventory Turnover 53.80 Notes: Covers Bizstats data for both independent refiners (e.g., Tesoro, Valero) and integrated oil & gas production companies who own refinery assets (e.g., Shell, ExxonMobil, Total, BP). It does not cover NYSE traded part State Owned Enterprises (SOE) of China, Brazil, Norway.
ROCE - conversion of raw materials to petrochemical intermediates (2010) • Return on Sales 4.36% • Return on Assets 2.44% • Return on Net Worth 11.30% • Quick Ratio 0.97 • Current Ratio 1.53 • Inventory Turnover 7.76 Notes: this includes Bizstats heading “resins, synthetic rubber, and fibers & filaments” for example polypropylene and not propylene, or PET resin and not para-xylene, ethylene glycol or dimethyl terephthalate.
What is Corn (Maize) Ethanol All About?Missouri is “The Show Me State” Source: University of Missouri - http://agebb.missouri.edu/
Corn (Maize) Ethanol – Follow the MoneyHigher Yields, Better Basis and Farm Incomes UpUS Farm Policy is a Success Bushels Per Acre!
Fundamental Economics - Petrochemicals • If integrated to large refinery complex (BASF, Shell, ExxonMobil, Saudi Aramco, etc.), then petrochemicals are world class cost basis • If a stand-alone facility, then purchasing of the key intermediates could be disadvantaged depending upon locations in the world. • Historic fuels/refinery ROI over 40 years averages 9.3% • Historic stand alone petrochemicals are 16.7% • Most integrated refinery and petrochemical plants have ROI between the two above since locations can widely vary the ROI. Billings, Montana and US Gulf Coast are examples. Source – www.bizstats.com
As Corn (maize) Producers have Done Wellso have the Petroleum (Oil) Producers – However,natural gas producers need to export from US(note “nominal” US$ per million btu)
The Two Primary Petrochemical RoutesThere is no significant “Upgrade in Value”
Fundamental Economics - Petrochemicals • If integrated to large refinery complex (BASF, Shell, ExxonMobil, Saudi Aramco, etc.), then petrochemicals are world class cost basis • If a stand-alone facility, then purchasing of the key intermediates could be disadvantaged depending upon locations in the world • Historic fuels/refinery ROI over 40 years averages 9.3% • Historic standalone petrochemicals are 16.7% • Most integrated refinery and petrochemical plants have ROI between the two above since locations can widely vary the ROI Source – www.bizstats.com
Can a completely integrated biorefinery make high ROCE? Closest analogue is the Cargill Nature Works/Corn Wet Mills and the world class pulp & paper mills (Chemrec/UPM in Sweden or MWV in US) • Petrochemicals from natural gas and condensates are cost “advantaged” low cost, low molecular weight (MW) • Petrochemicals from petroleum crude oil are “disadvantaged” today due to high MW or energy density • Lipids can only come from land or algae (e.g., Solazyme) • Lowest costs are SEAsia (palm) and Brazil (sugar) • Race is to build high MW from low cost MW like sugar or petrochemicals
Conclusions • Financial analysts use a variety of tools to evaluate biofuel, biomass, algae, biochemical, etc. investments today • CAPM is a common tool for equity analysts • Historic data and benchmarks such as Bizstats allow analysts to advise fund mangers • To Review – ROCE (Net Equity and Debt): • Oil and Gas Extraction 13.04% • Cooperative Ag and Forestry 19.41% • Basic Chemicals 4.52% • Petroleum Refining 9.34% • Conversion to Petrochemicals 11.30% • This emerging industry needs to demonstrate over 20% ROCE to attract capital against these benchmarks using existing IPO Beta and CAPM but not for biopharmaceuticals Thank you for your time and attention to our presentation