Download
1 / 22
220 likes | 353 Views
PCyg. . MWC 361. Circumstellar environments with VEGA/CHARA. Cet. Isabelle Tallon-Bosc Thibaut Merle Karine Perraut & VEGA team. Karine PERRAUT ( karine.perraut@obs.ujf-grenoble.fr ) Myriam Benisty (IPAG) Denis Mourard (OCA) Gustavo Lima (IPAG until june 2012)

E N D
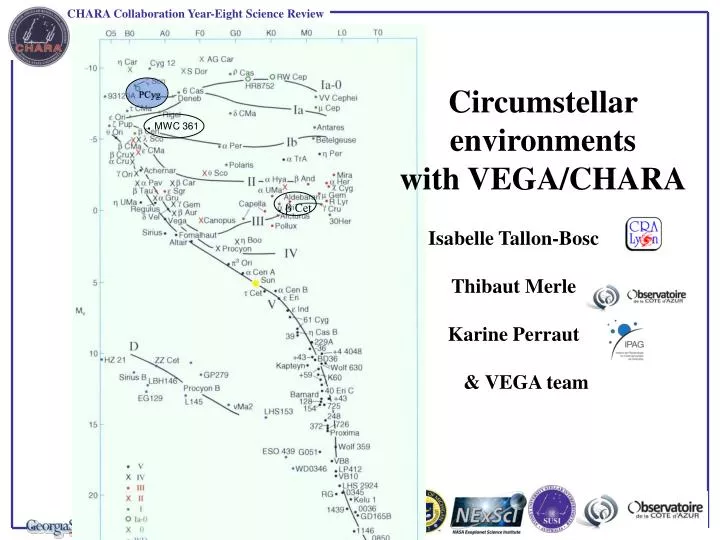
PCyg . MWC 361 Circumstellar environments with VEGA/CHARA Cet Isabelle Tallon-Bosc Thibaut Merle Karine Perraut & VEGA team
Karine PERRAUT (karine.perraut@obs.ujf-grenoble.fr) Myriam Benisty (IPAG) Denis Mourard (OCA) Gustavo Lima (IPAG until june 2012) Catherine Dougados (IPAG) Study of the Ha emission in Herbig AeBe stars CO biconical cavity formed by the outflow activity MWC361 (Herbig Be) AB Aur (HerbigAe) NGC7023 CO extended disk Period ~ 1377 days
VEGA spectrum over the orbit High state Low state
Ha Equivalent Width Periastron EW clearly increases at the periastron.
VEGA visibility data set We deduce the flux ratio between components in the visible: R = 0.160 ± 0.012
We deduce the visibility in the Ha line and then the characteristic size of the emitting region assuming a gaussian disk model. Periastron Node Characteristic size of the Ha emitting region Periastron Node
To be submitted in the coming weeks MWC361 – Conclusions
P Cygni Isabelle Tallon-Bosc Michel Tallon CRAL Olivier Chesneau OCA Luc Dessart OAMP Vakili et al 1997, GI2T • LBV (luminous blue variable) • transition phase of ~40000 years to Wolf-Rayet • Nova phenomena in 1600, 1655, 1665, … • stable enough now • Teff ~ 20000 K • M*~ 30 M☉ • mass-loss ~10-4M☉/an • d ~ 1.8 +/- 0.1 kpc(Lamers et al.1983) • R* ~ 76 R☉ (~0.2 mas) ==> ØUD= 0.4 mas
Previous observations at the visible • GI2T (1994) : ØUD (H)~ 5.5 mas ØUD (HeI -667.8) ~ 2.5 mas (Baseline = 17.7m R=3800) • NPOI Measures Balan et al. 2010 • Baselines of 19 - 80 m, 2005, 2007, 2008. • Differential V2(H) • continuum supposed to be with ØUD~ 0.2 mas (~Dirac) • variation of results < 1% for ØUD continuum varying from 0 to 1 mas • 4 differential phase closures => object is symmetric • 15 spectral channels from 560 to 870 nm. • spectral channel on H: = 15 nm • Fitted models : • ØUD= 0.2 mas (70%) + ØG= 5.64 mas (17%) + ØG= 1.8 mas (13%) 2=1.5 • ØUD= 0.2 mas (72%) + ØG= 5.46 mas (18%) + ØUD= 3.06 mas (10%) 2=1.5 • ØUD= 0.2 mas (79%) + ØUD= 7.2 mas (21%) 2=2.8
VEGA Observations • 12 nights in 2008, 2010 S1S2, E1E2, W1W2, and 1 triplet W2W1E2 in 2011, • of different quality • different calibrators (some bad... :-( ) : • the last used : HD192640 ØUD= 0.445 mas • the most used : HD188892 ØUD= 0.225 mas (same as Balan et al.) c = 645nm =15nm H HeI 667.8 15nm c = 475nm =18nm H 25nm
W2W1 106m W2E2 152m W1E2 246m V2 Measurements atc = 645nm (15nm) Ø*UD=0.65 +/- 0.01 mas i_* = 0.95 +/- 0.24 i_bg = 0.05 +/- 0.01 2 = 4.892 = 0.41 FWHM*=0.40 +/- 0.01 mas i_* = 0.95 +/- 0.24 i_bg = 0.05 +/- 0.01 2 =5.05 2 = 0.41
Comparison with NPOI results Fitted models by Balan et al.: ØUD= 0.2 mas (79%) fixed + ØUD= 7.2 mas (21%) 2=2.81 ØUD= 0.2 mas (70%) fixed + ØG= 5.64 mas (17%) + ØG= 1.8 mas (13%) 2=1.5 But if ØUD= 0.4 mas (79%) fixed then ØUD= 7.3 mas (21%) 2 ↘ 2.38 And making ØUD free : ØUD= 0.74 mas +/- 0.01(82%) + ØUD= 7.75+/-0.3 mas (18%) 2 ↘ 1.812=0.036 And adding a background : ØUD= 0.65 +/- 0.01 mas (79%) + ØUD, H= 5.56+/-0.12 mas (9%) + bg (11%) 2 ↘1.582=0.036 - Compatibility of VEGA and GI2T measurements with NPOI measurements - Several models may be suitable
Comparison with NPOI results • Best fitted model by Balan et al.: • ØUD= 0.2 mas (70%) fixed + ØG= 1.8+/-0.13 mas (13%) + ØG= 5.64+/-0.17 mas (17%) 2=1.528 But if ØUD= 0.4 mas (79%) fixed then ØG= 2.18 +/-0.13 mas (10%) + ØG= 5.82 +/-0.22 mas (16.5%) 2 =1.5222=0.036 And adding a background : ØUD= 0.4 mas (73%) ØG= 1.79 +/-0.3 mas (8%) + ØG= 4.57 +/-0.4 mas (13.5%) + bg (5.5%) 2 =1.5242=0.036 Several ‘ best fitted’ models
Adding VEGA measurements Ø*UD= 0.65 +/- 0.01 mas ØUD,wind = 5.58 +/- 0.12 mas i_* = 0.795 +/- 0.020 i_w = 0.095 +/- 0.003 i_bg = 0.11 +/- 0.004 2 =1.655 2=0.036 FWHM*= 0.37 +/- 0.01 mas FWHMwind = 4.03 +/- 0.12 mas i_* = 0.78 +/- 0.020 i_w = 0.155 +/- 0.003 i_bg = 0.065 +/- 0.008 2 =1.618 2=0.036 2 ↗ slightly Probably no radial symmetry
First H measurements c = 475nm =18nm Ø*UD=0.40 +/- 0.04 mas Ø*UD= 0.4 mas fixed ØUD,wind = 1.59 +/- 0.42 mas i_w = 0.22+/- 0.07 2 =1.18 c = 486nm =25nm For the same uv-coverage, go to the ...
jump jump 35nm step 0.1nm 0.2nm Differential visibilities V() HeI 667.8 H Vc B 30.6m PA -38.5° jump B 62.2m PA -107.7° B 98.5m PA 116.7°
25nm step 0.5nm 1nm V() around H H B 62.2m PA -107.7° Calibrator
V measured Theoritical model CMFGEN • line-blanketed non-LTE model-atmosphere CMFGEN (Dessart & Hillier 2005 after Najarro model) 76 R☉ Fit of data sets at # with LITpro under way Radial profile Ip of the contiuum near the H line versus the distance from the center of the star in R☉
Conclusions • to present this work in a paper, whatever the result of the fit is. • to observe again P Cygni in a next future : • ➛ model of the object more refined, • taking into account the obvious asymetries • ➛contemporaneous data on H and Br lines • thanks to the dual and successfull VEGA/CLIMB operational mode