Download
1 / 27
570 likes | 1.38k Views
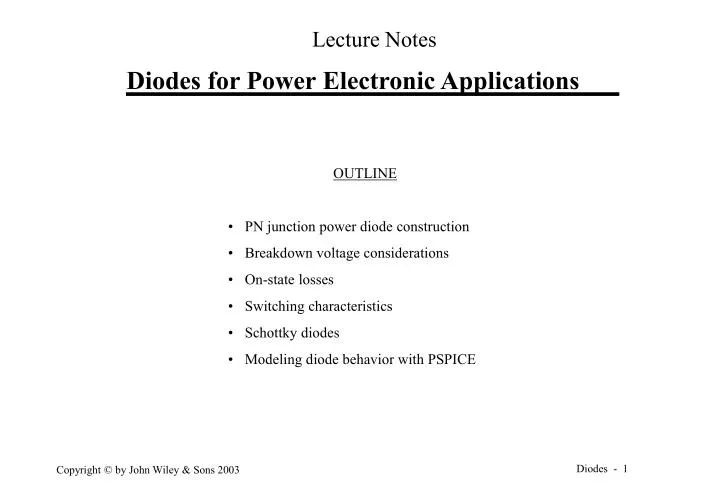
Lecture Notes. Diodes for Power Electronic Applications. OUTLINE • PN junction power diode construction • Breakdown voltage considerations • On-state losses • Switching characteristics • Schottky diodes • Modeling diode behavior with PSPICE. Basic Structure of Power Semiconductor Diodes.

E N D
Lecture Notes Diodes for Power Electronic Applications OUTLINE • PN junction power diode construction • Breakdown voltage considerations • On-state losses • Switching characteristics • Schottky diodes • Modeling diode behavior with PSPICE
Control of Space Charge Layer Boundary Contour • Electrically isolated conductors (field plates) act as equipotential surfaces. • Correct placement can force depletion layer boundary to have larger radius of curvature and t;hus minimize field crowding. • Electrically isolated p-regions (guard rings)has depletion regions which interact with depletion region of main pn junction. • Correct placement of guard rings can result in composite depletion region boundary having large radius of curvature and thus minimize field crowding.
Surface Contouring to Minimize Field Crowding • Large area diodes have depletion layers that contact Si surface. • Difference in dielectric constant of Si and air causes field crowding at surface. • Electric fields fringing out into air attract impurities to surface that can lower breakdown voltage. • Proper contouring of surface can mimimize depletion layer curvature and thus field crowding. • Use of a passivation layer like SiO2 can also help minimize field crowding and also contain fringing fields and thus prevent attraction of impurities to surface.
Conductivity Modulation of Drift Region • Forward bias injects holes into drift region from P+ layer. Electrons attracted into drift region from N+ layer. So-called double injection. • If Wd ≤ high level diffusion length La , carrier distributions quite flat with p(x) ≈ n(x) ≈ na. • For na >> drift region doping Nd, the resistance of the drift region will be quite small. So-called conductivity modulation. • On-state losses greatly reduced below those estimated on basis of drift region low-level (Nd) ohmic conductivity.
Diode Internal Behavior During Turn-on • Injection of excess carriers into drift region greatly reduces Rd.
PSPICE Built-in Diode Model • Components • Circuit diagram
Stored Charge in Diode Drift Region - Actual Versus Quasi-static Approximation • One dimensional diagram of a power diode. • Quasistatic view of decay of excess carrier distribution during diode turn-off. n(x,t) = n(x=0,t) f(x) • Redistribution of excess carriers via diffusion ignored. Equ;ivalent to carriers moving with inifinte velocity. • Actual behavior of stored charge distribution during turn-off.
Example of Faulty Simulation Using Built-in Pspice Diode Model • Test circuit example - step-down converter. • PSPICE diode model parameters - (TT=100ns Cjo=100pF Rs=.004 Is=20fA) • Diode voltage transient • Diode current transient.
Improved (lumped-charge) Diode Model • More accurately model distributed nature of excess carrier distribution by dividing it into several regions, each described by a quasi-static function. Termed the lumped-charge approach. • Circuit diagram of improved diode model. Circuit written in terms of physical equations of the lumped-charge model. • Detailed equations of model given in subcircuit listing. • Many other even better (but more complicated models available in technical literature..
Details of Lumped-Charge Model Subcircuit Listing .Subckt DMODIFY 1 9 Params: Is1=1e-6, Ise=1e-40, Tau=100ns, +Tm=100ns,Rmo=Rs=.001, Vta=.0259, CAP=100p, Gde=.5, + Fbcoeff=.5, Phi=1, Irbk=1e20,Vrbk=1e20 *Node 1= anodeand Node 9 = cathode Dcj 1 2 Dcap ; Included for space charge capacitance and reverse *breakdown. .model Dcap D (Is=1e-25 Rs=0 TT=0 Cjo={CAP} M={Gde} +FC={Fbcoeff} Vj={Phi} +IBV={Irbk} BV=Vrbk}) Gd 1 2 Value={(v(5)-v(6))/Tm +Ise*(exp(v(1,2)/Vta)-1)} *Following components model forward and reverse recovery. Ee 5 0 VALUE = {Is1*Tau*(exp(V(1,2)/(2*Vta))-1)}; Ee=Qe Re 5 0 1e6 Em 6 0 VALUE = {(V(5)/Tm-i(Vsense1))*Tm*Tau/(Tm+Tau)} *Em=Qm Rm 6 0 1e6 Edm 7 0 VALUE = {v(6)};Edm=Qm Vsense1 7 8 dc 0 ; i(vsense1)=dQm/dt Cdm 8 0 1 Rdm 8 0 1e9 Rs 2 3 4e-3 Emo 3 4 VALUE={2*Vta*Rmo*Tm*i(Vsense2) +/(v(6)*Rmo+Vta*Tm)}; Vm Vsense2 4 9 dc 0 .ends • Symbolize subcircuit listing into SCHEMATICS using SYMBOL WIZARD • Pass numerical values of parameters Tau, Tm, Rmo,Rs, etc. by entering values in PART ATTRIBUTE window (called up within SCHEMATICS). • See reference shown below for more details and parameter extraction procedures. • Peter O. Lauritzen and Cliff L. Ma, "A Simple Diode Model with Forward and Reverse Recovery", IEEE Trans. on Power Electronics, Vol. 8, No. 4, pp. 342-346, (Oct., 1993)
Simulation Results Using Lumped-Charge Diode Model Diode voltage and current waveforms Simulation Circuit • Note soft reverse recovery and forward voltage overshoot. Qualitatively matches experimental measurements.