Download

1 / 68
680 likes | 688 Views
This article explores color models and human vision, discussing how light, color, and perception work together. It covers topics such as the electromagnetic spectrum, perception of object colors, and color representation models.

E N D
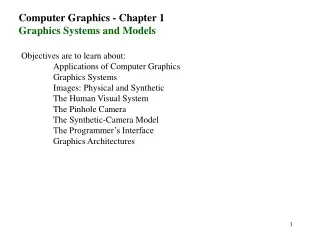
3D Rendering pipeline Modeling transformation Transform into 3D world system Illuminate according to lighting and reflectance lighting Transform into 3D camera coordinate system Viewing transformation Transform into 2D camera system Project transformation Clip primitives outside camera’s view Clipping Draw pixels (includes texturing, hidden surface, etc.) Scan conversion Image
3D Rendering pipeline Modeling transformation Transform into 3D world system Illuminate according to lighting and reflectance lighting Transform into 3D camera coordinate system Viewing transformation Transform into 2D camera system Project transformation Clip primitives outside camera’s view Clipping Draw pixels (includes texturing, hidden surface, etc.) Scan conversion Image
Light and Colors • How to describe light color? • Why the same object appears different color under different light? • How to model the color of reflected light?
Outline • Color Models • Required readings: HB 19-1 to 19-8
Human Vision Model of human vision
Human Vision Model of human vision • Vision components: • Incoming light • Human eye
Electromagnetic Spectrum Visible light frequencies range between: • Red: 3.8x10¹⁴ hertz (780nm) • Violet: 7.9x10¹⁴ hertz (380nm)
Visible Light The human eye can see “visible” light in the frequency between 380nm-780nm red violet
Visible Light The human eye can see “visible” light in the frequency between 380nm-780nm 380nm 780nm
Visible Light The human eye can see “visible” light in the frequency between 380nm-780nm 380nm 780nm • Each frequency value between 380nm-780nm corresponds to a distinct spectral color • Not strict boundary • Some colors are absent (brown, pink)
Spectral Energy Distribution Three different types of lights
Perception of Object Colors • Why does the same object appear different color under different light?
Perception of Object Colors • When light is incident upon an object, some frequencies are reflected and some are absorbed. • The combination of frequencies present in the reflected light determines what we perceive as the color of the object.
Questions • Why does some object appear black under sunlight? • How does the white object appear lit only by blue light? • How does the red object appear lit only by blue light?
Questions • Why does some object appear black under sunlight? Absorb all the frequencies • How does the white object appear lit only by blue light? “blue” • How does the red object appear lit only by blue light? “black”
Spectral Energy Distribution Three different types of lights Can we use spectral energy distribution to represent color?
Spectral Energy Distribution Three different types of lights Can we use spectral energy distribution to represent color? - Not really, different distribution might result in the same color (metamers)!
Spectral Energy Distribution The six spectra below look the same purple to normal color-vision people
Ideal Color Representation • Unique – one to one mapping • Compact – require minimal number of bits. • General – represent all the visible light. • Perceptually appropriate – tell us luminance, purity and saturation of color.
Color Representation? Why not all ranges of light spectrum are perceived? So how to represent color? 380nm 780nm
Human Vision Photoreceptor cells in the retina: - Rods - Cones
Human Vision Photoreceptor cells in the retina: - Rods - Cones
Light Detection: Rods and Cones Rods: -120 million rods in retina -1000X more light sensitive than Cones - Discriminate B/W brightness in low illumination - Short wave-length sensitive Cons: - 6-7 million Cones in the retina - Responsible for high-resolution vision - Discriminate Colors - Three types of color sensors (64% red, 32%, 2% blue) - Sensitive to any combination of three colors
Tristimulus of Color Theory Spectral-response functions of each of the three types of cones
Tristimulus of Color Theory Spectral-response functions of each of the three types of cones Color matching function based on RGB - any spectral color can be represented as a linear combination of these primary colors
Tristimulus Color Theory So, color is psychological - Representing color as a linear combination of red, green, and blue is related to cones, not physics - Most people have the same cones, but there are some people who don’t – the sky might not look blue to them (although they will call it “blue” nonetheless) - But many people (mostly men) are colorblind, missing 1,2 or 3 cones (can buy cheaper TVs)
Additive and Subtractive Color RGB color model CMY color model White: [0 0 0]T Green: [1 0 1]; White: [1 1 1]T Green: [0 1 0]; Complementary color models: R=1-C; G = 1-M; B=1-Y;
RGB Color Space blue green red
RGB Color Space blue White (1,1,1) green red
RGB Color Space blue magenta (1,0,1) green red
RGB Color Space blue magenta (1,0,1) green red RGB cube • Easy for devices • Can represent all the colors? • But not perceptual • Where is brightness, hue and saturation?
Tristimulus • Since 3 different cones, the space of colors is 3-dimensional. • We need a way to describe color within this 3 dimensional space. • No finite set of light sources can be combined to display all possible colors. • We want something that will let us describe any visible color with additive combination of three primary (imaginary) colors!
The CIE XYZ system • CIE – Comission Internationale de l’Eclairage - International Commission on Illumination - Sets international standards related to light • Defined the XYZ color system as an international standard in 1931 • X, Y, and Z are three Primary colors. - imaginary colors - all visible colors can be defined as an additive combination of these three colors. - defines the 3 dimensional color space
Color Matching Functions • Given an input spectrum, , we want to find the X, Y, Z coordinates for that color. • Color matching functions, , , and tell how to weight the spectrum when integrating: Image taken from http://upload.wikimedia.org/wikipedia/commons/8/87/CIE1931_XYZCMF.png
XYZ space • Any color can be represented in the XYZ space as an additive combination of three primary colors
XYZ space • The visible colors form a “cone” in XYZ space. • For visible colors, X, Y, Z are all positive. • But, X, Y, and Z themselves are not visible colors! Image taken from http://fourier.eng.hmc.edu/e180/handouts/color1/node27.html
Luminance and Chromaticity • The intensity (luminance) is just X+Y+Z. • Scaling X, Y, Z just increases intensity. • We can separate this from the remaining part, chromaticity. • Color = Luminance + Chromaticity • Chromaticity is 2D, Luminance is 1D • To help us understand chromaticity, we’ll fix intensity to the X+Y+Z=1 plane.
Chromaticity Diagram • Project the X+Y+Z=1 slice along the Z-axis • Chromaticity is given by the x, y coordinates Image taken from http://fourier.eng.hmc.edu/e180/handouts/color1/node27.html
Functions of Chromaticity Diagram • Determining purity and dominant wave length for a given color • Identify complementary colors • Compare color gamuts for different primaries Image taken from http://fourier.eng.hmc.edu/e180/handouts/color1/node27.html
White Point • White: at the center of the diagram. • Approximation of average daylight Image taken from http://fourier.eng.hmc.edu/e180/handouts/color1/node27.html
Spectral Colors • Visible Spectrum along outside curve Image taken from http://fourier.eng.hmc.edu/e180/handouts/color1/node27.html
Spectral Colors • Visible Spectrum along outside curve But this is not Spectral color! Image taken from http://fourier.eng.hmc.edu/e180/handouts/color1/node27.html
Saturation/Purity • As you move on line from white to edge, you increase the saturation of that color. • Royal blue, red: high saturation • Carolina blue, pink: low saturation Image taken from http://fourier.eng.hmc.edu/e180/handouts/color1/node27.html
Saturation/Purity • How to compute the purity of this color? C B - The ratio between dAB and dAC A Image taken from http://fourier.eng.hmc.edu/e180/handouts/color1/node27.html
Hue • Hue is the “direction” from white. • Combined with saturation, it gives another way to describe color • Also called dominant wavelength Image taken from http://fourier.eng.hmc.edu/e180/handouts/color1/node27.html
Hue • What’s the dominant wavelength of this color? Image taken from http://fourier.eng.hmc.edu/e180/handouts/color1/node27.html
Hue • What’s the dominant wavelength of this color? Image taken from http://fourier.eng.hmc.edu/e180/handouts/color1/node27.html
Hue • What’s the dominant wavelength of this color? Image taken from http://fourier.eng.hmc.edu/e180/handouts/color1/node27.html
Hue • What’s the dominant wavelength of this color? Image taken from http://fourier.eng.hmc.edu/e180/handouts/color1/node27.html