Download
1 / 17
170 likes | 188 Views
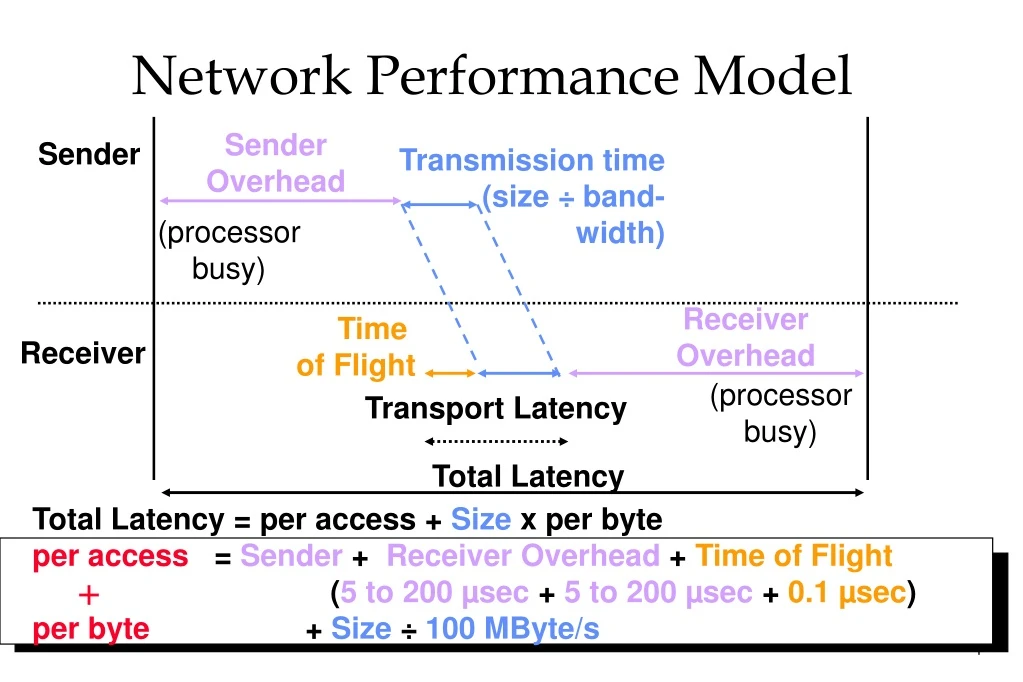
Network Performance Model. Sender Overhead. Sender. Transmission time (size ÷ band- width). (processor busy). Receiver Overhead. Time of Flight. Receiver. (processor busy). Transport Latency. Total Latency. Total Latency = per access + Size x per byte

E N D
Network Performance Model Sender Overhead Sender Transmission time (size ÷ band- width) (processor busy) Receiver Overhead Time of Flight Receiver (processor busy) Transport Latency Total Latency Total Latency = per access + Size x per byte per access = Sender+ ReceiverOverhead+ Time of Flight (5 to 200 µsec+5 to 200 µsec+ 0.1 µsec) per byte + Size ÷ 100 MByte/s +
Network History/Limits • TCP/UDP/IP protocols for WAN/LAN in 1980s • Lightweight protocols for LAN in 1990s • Limit is standards and efficient SW protocols 10 Mbit Ethernet in 1978 (shared) 100 Mbit Ethernet in 1995 (shared, switched) 1000 Mbit Ethernet in 1998 (switched) • FDDI; ATM Forum for scalable LAN (still meeting) • Internal I/O bus limits delivered BW • 32-bit, 33 MHz PCI bus = 1 Gbit/sec • future: 64-bit, 66 MHz PCI bus = 4 Gbit/sec
Network Summary • Fast serial lines, switches offer high bandwidth, low latency over reasonable distances • Protocol software development and standards committee bandwidth limit innovation rate • Ethernet forever? • Internal I/O bus interface to network is bottleneck to delivered bandwidth, latency
Memory History/Trends/State of Art • DRAM: main memory of all computers • Commodity chip industry: no company >20% share • Packaged in SIMM or DIMM (e.g.,16 DRAMs/SIMM) • State of the Art: $152, 128 MB DIMM (16 64-Mbit DRAMs),10 ns x 64b (800MB/sec) • Capacity: 4X/3 yrs (60%/yr..) • Moore’s Law • MB/$: + 25%/yr. • Latency: – 7%/year, Bandwidth: + 20%/yr. (so far) source: www.pricewatch.com, 5/21/98
Memory Innovations/Limits • High Bandwidth Interfaces, Packages • RAMBUS DRAM: 800 – 1600 MByte/sec per chip • Latency limited by memory controller, bus, multiple chips, driving pins • More Application Bandwidth => More Cache misses= per access + block size x per byte Memory latency + Size / (DRAM BW x width) = 150 ns + 30 ns • Called Amdahl’s Law: Law of diminishing returns Proc Cache Bus D R A M D R A M D R A M D R A M
Memory Summary • DRAM rapid improvements in capacity, MB/$, bandwidth; slow improvement in latency • Processor-memory interface (cache+memory bus) is bottleneck to delivered bandwidth • Like network, memory “protocol” is major overhead
CPU time = Seconds = Instructions x Clocks x Seconds Program Program Instruction Clock Processor Trends/ History • Microprocessor: main CPU of “all” computers • < 1986, +35%/ yr. performance increase (2X/2.3yr) • >1987 (RISC), +60%/ yr. performance increase (2X/1.5yr) • Cost fixed at $500/chip, power whatever can cool • History of innovations to 2X / 1.5 yr (Works on TPC?) • Multilevel Caches (helps clocks / instruction) • Pipelining (helps seconds / clock, or clock rate) • Out-of-Order Execution (helps clocks / instruction) • Superscalar (helps clocks / instruction)
State of the Art: Alpha 21264 • 15M transistors • 2 64KB caches on chip; 16MB L2 cache off chip • Clock <1.7 nsec, or >600 MHz (Fastest Cray Supercomputer: T90 2.2 nsec) • 90 watts • Superscalar: fetch up to 6 instructions/clock cycle, retires up to 4 instruction/clock cycle • Execution out-of-order
µProc 60%/yr.. 1000 CPU “Moore’s Law” 100 Processor-Memory Performance Gap:(grows 50% / year) Performance 10 DRAM 7%/yr.. DRAM 1 1980 1981 1982 1983 1984 1985 1986 1987 1988 1989 1990 1991 1992 1993 1994 1995 1996 1997 1998 1999 2000 Processor Limit: DRAM Gap • Alpha 21264 full cache miss in instructions executed: 180 ns/1.7 ns =108 clks x 4 or 432 instructions • Caches in Pentium Pro: 64% area, 88% transistors
Processor Limits for TPC-C SPEC- Pentium Pro int95 TPC-C • Multilevel Caches: Miss rate 1MB L2 cache 0.5% 5% • Superscalar (2-3 instr. retired/clock): % clks 40% 10% • Out-of-Order Execution speedup 2.0X 1.4X • Clocks per Instruction 0.8 3.4 • % Peak performance 40% 10% source: Kim Keeton, Dave Patterson, Y. Q. He, R. C. Raphael, and Walter Baker. "Performance Characterization of a Quad Pentium Pro SMP Using OLTP Workloads," Proc. 25th Int'l. Symp. on Computer Architecture, June 1998. (www.cs.berkeley.edu/~kkeeton/Papers/papers.html ) Bhandarkar, D.; Ding, J. “Performance characterization of the Pentium Pro processor.” Proc. 3rd Int'l. Symp. on High-Performance Computer Architecture, Feb 1997. p. 288-97.
Processor Innovations/Limits • Low cost , low power embedded processors • Lots of competition, innovation • Integer perf. embedded proc. ~ 1/2 desktop processor • Strong ARM 110: 233 MHz, 268 MIPS, 0.36W typ., $49 • Very Long Instruction Word (Intel,HP IA-64/Merced) • multiple ops/ instruction, compiler controls parallelism • Consolidation of desktop industry? Innovation? x86 IA-64 SPARC Alpha PowerPC MIPS PA-RISC
Processor Summary • SPEC performance doubling / 18 months • Growing CPU-DRAM performance gap & tax • Running out of ideas, competition? Back to 2X / 2.3 yrs? • Processor tricks not as useful for transactions? • Clock rate increase compensated by CPI increase? • When > 100 MIPS on TPC-C? • Cost fixed at ~$500/chip, power whatever can cool • Embedded processors promising • 1/10 cost, 1/100 power, 1/2 integer performance?
Systems: History, Trends, Innovations • Cost/Performance leaders from PC industry • Transaction processing, file service based on Symmetric Multiprocessor (SMP)servers • 4 - 64 processors • Shared memory addressing • Decision support based on SMP and Cluster (Shared Nothing) • Clusters of low cost, small SMPs getting popular
State of the Art System: PC • $1140 OEM • 1 266 MHz Pentium II • 64 MB DRAM • 2 UltraDMA EIDE disks, 3.1 GB each • 100 Mbit Ethernet Interface • (PennySort winner) source: www.research.microsoft.com/research/barc/SortBenchmark/PennySort.ps
TPC-D,Oracle 8, 3/98 SMP 64 336 MHz CPUs, 64GB dram, 668 disks (5.5TB) Disks,shelf $2,128k Boards,encl. $1,187k CPUs $912k DRAM $768k Power $96k Cables,I/O $69k HW total $5,161k Proc Proc Proc Proc Proc Proc Proc Proc s s bridge bridge bus bridge bus bridge s c s i s c s i s c s i s c s i s c s i s c s i State of the Art SMP: Sun E10000 4 address buses data crossbar switch Xbar Xbar Mem Mem … 16 1 s c s i s c s i s c s i s c s i … … … … … … … … … 23 source: www.tpc.org 1
TPC-D, TD V2, 10/97 32 nodes x 4 200 MHz CPUs, 1 GB DRAM, 41 disks (128 cpus, 32 GB, 1312 disks, 5.4 TB) CPUs, DRAM, encl., boards, power $5,360k Disks+cntlr $2,164k Disk shelves $674k Cables $126k Console $16k HW total $8,340k Proc Proc Proc Proc Proc Proc Proc Proc Mem bridge bridge Mem Mem bus bridge bus bridge s c s i s c s i s c s i s c s i s c s i s c s i State of the art Cluster: NCR WorldMark BYNET switched network Bus Bus Mem pci pci … 32 1 … … … … … … … … … 64 1 source: www.tpc.org
State of the Art Cluster: Tandem/Compaq SMP • ServerNet switched network • Rack mounted equipment • SMP: 4-PPro, 3GB dram, 3 disks (6/rack) • 10 Disk shelves/rack@ 7 disks/shelf • Total: 6 SMPs (24 CPUs, 18 GB DRAM), 402 disks (2.7 TB) • TPC-C, Oracle 8, 4/98 • CPUs $191k • DRAM, $122k • Disks+cntlr $425k • Disk shelves $94k • Networking $76k • Racks $15k • HW total $926k