Download
1 / 35
350 likes | 356 Views
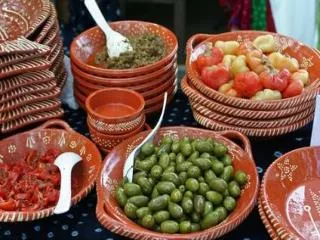
This presentation provides the results of a consumer acceptance test conducted on different water samples. The analysis includes taste ratings and flavor profiles to determine the most acceptable options.

E N D
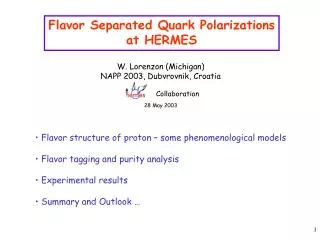
Results from Consumer Taste Tests& Flavor Profile AnalysisJuly 2006 Presentation to Dublin San Ramon Services District Water Committee September 21, 2006
Introduction • Fall 2003, a Customer Satisfaction Survey indicated the biggest issue was drinkability (taste) of the water • December 2004, a telephone survey by conducted Fairbanks, Maslin, Maullin & Associates found DSRSD customers thought that their tap water was only fair/poor in drinkability. • November 2005, in an effort to improve the drinkability of the water, DSRSD asked The NFL for assistance in conducting a consumer acceptance test on 11 samples of water from different sources/treatments. • After reviewing results of the November test, DSRSD was interested in determining the consumer acceptance of 6 additional samples of water collected during the summer. • DSRSD requested that McGuire Malcolm Pirnie perform another FPA and evaluation of results
CONSUMER ACCEPTANCE TESTOFWATERPresented to Dublin San Ramon Services District (DSRSD)September 2006
Methodology • 111 Dublin residents participated • Males and Females (41%/59%) • Ages 21-65 • DSRSD Customers • 66 live in Western/Central Dublin, 26 live in Eastern Dublin, 19 live in Dougherty Valley • Drink water (any type: bottled, tap, filtered) at least once a day • No past 3 months participation in a consumer test
Quantitative Taste Test Design • Respondents evaluated 6 samples on Wednesday, July 26, 2006 • Samples were served one at a time • Respondents drank as much as they needed to form an opinion, then completed a self-administered questionnaire • Four (4) ounces of each sample were served in a clear plastic cup coded with a 3-digit number • Serving order was balanced such that each sample was evaluated in each serving position approximately an equal number of times • Samples were served at room temperature • Samples were collected on July 25, 2006 and were provided by DSRSD
Water Samples Tested • Turn out 2 • Turn out 5 • Mocho 4 well water • Del Valle Treatment Plant • EBMUD • San Francisco Hetch Hetchy
Summary of Results • EBMUD and San Francisco Hetch Hetchy were more acceptable than all other samples in overall liking. • EBMUD was rated more acceptable than all other samples in overall flavor. • Turn out 2, turn out 5 and Mocho 4 well were rated similarly in overall liking and overall flavor. • Del Valle Treatment plant was rated lower than all other samples in overall liking, appearance, overall aroma and overall flavor.
*Products within a bracket are not significantly different at the 90% confidence level
*Products within a bracket are not significantly different at the 90% confidence level
*Products within a bracket are not significantly different at the 90% confidence level
*Products within a bracket are not significantly different at the 90% confidence level
Conclusions Within DSRSD’s water supply, Turnout 2, Turnout 5, and Mocho 4 Well Water ratings were comparable, with Turnout 5 having an advantage over Turnout 2 in flavor liking. Del Valle Treatment Plant, similar to the November test, was least liked and was characterized as having a “dirty/dusty/muddy” taste.
Results from Consumer Taste Tests and Focus Groups James R. Leserman and Michael J. McGuire 14
Purposes of Study II • Verify 11/2005 results • Compare summer vs. late fall/winter • Determine causes of off-flavors • Recommend possible remedies
Water Samples for Testing • Samples were selected to reflect and compare: • DSRSD sources (DVWTP & Mocho 4 Well) • Distribution System (2 sites) • Two “reputable” supplies (EBMWD & Hetch Hetchy) • Samples were analyzed by the Zone 7 Laboratory and a contract laboratory for a variety of parameters.
NFL Findings • DVWTP had lowest rating (as it was in 11/2005) • Mocho well water was rated higher overall • For NFL flavor rating results: • Mocho well water and Distribution system sites were intermediate • EBMUD water rated the highest • Hetchy Hetch was second, better than 11/2005
Effect of Geosmin on NFL Flavor Rating Geosmin OTC
Correlation Coefficients (r2 values) for Water Quality and NFL Flavor Rating The correlation coefficient is a statistic that gives a measure of how closely two variables are related. A correlation coefficient of +1 or -1 would indicate perfect correlation.
Correlation Coefficients (r2 values) for Water Quality and NFL Flavor Rating
Water Quality Impacts on Flavor Rating • NFL Flavor ratings appeared to have an inverse relationship with: • Increasing geosmin level • Increasing chlorine residual • Increasing chloride concentration • No relationship appeared to exist between NFL Flavor Rating and hardness
Flavor Profile Method • Developed in 1948 by Sjostrom and Cairncross of Arthur D. Little, Inc. • Adapted to the drinking water field by McGuire and Krasner in 1981 • Expert panel of 4-6 members • Intensities determined based on standards • Sensory characteristics determined based on experience of panelists • Panel outcome based on consensus
FPA Results for Del Valle WTP 11/2005 7/2006
FPA Results for Mocho 4 Well 7/2006 11/2005
FPA Results for San Francisco PUC 7/2006 (Hetchy Hetchy upstream of Sunol Valley WTP) 11/2005 (Hetch Hetchy/Sunol Valley WTP Blend)
FPA Results for Turn Out 2 7/2006
FPA Results for East Bay MUD 7/2006
Summary and Conclusions • For NFL flavor rating results: • DVWTP had lowest rating (as it was in 11/2005) • Mocho well water or Mocho DVWTP blends were intermediate • EBMUD water rated the Hetchy Hetch was second, better than 11/2005 • NFL Flavor ratings appeared to have an inverse relationship with: • Increasing geosmin level • Increasing chlorine residual • Increasing chloride concentration • No relationship appeared to exist between NFL Flavor Rating and hardness
Summary and Conclusions (cont.) • FPA results indicate: • DVWTP sample had Earth/musty odors and off-flavors • The Mocho well sample had only slight odors and was flavor free • DSRSD distribution system samples had slight chlorine and musty odors/flavors. • New pump station had pencil shaving odors and flavors
Recommendations • Continue discussions with Zone 7 to consider the implementation of treatment techniques to improve the aesthetic quality of water delivered to DSRSD, including: • Granular activated carbon or ozone/hydrogen peroxide for taste and odor control caused by geosmin and MIB • Membrane techniques to reduce mineral levels in sources • Reduction of the total chlorine residual is not recommended • Consider performing further work to compare effect of RO on Zone 7 groundwater
Questions ? Contact: James R. Leserman Michael J. McGuire McGuire Malcolm Pirnie 1821 Wilshire Blvd., Suite 302 Santa Monica, CA 90403 310-829-1441 mmcguire@pirnie.com