Download
1 / 29
300 likes | 522 Views
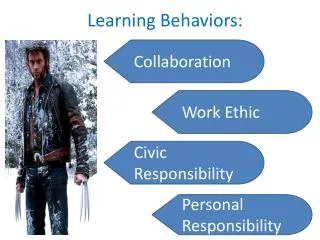
The Learning Behaviors Scale. P. A. McDermott, L. F. Green, J. M. Francis, & D. H. Stott. Description of the LBS I. 29 items, each presenting a specific learning-related behavior

E N D
The Learning Behaviors Scale P. A. McDermott, L. F. Green, J. M. Francis, & D. H. Stott
Description of the LBS I • 29 items, each presenting a specific learning-related behavior • Observer is required to indicate whether behavior Most often applies,Sometimes applies, or Does not apply. • Some items indicate positive learning behaviors and others indicate negative behaviors to reduce response sets.
LBS Description II • The 29 items provide 4 subscale scores: • Competence Motivation (8 items) • Attitude Toward Learning (9 items) • Attention/Persistence (7 items) • Strategy/Flexibility (7 items) • Subscales allow for targeted intervention • You can also obtain a global LBS score
CONTEXT FOR DEVELOPMENT I • Knowing that a student is “bright” or “not as bright” does not fully explain performance • Knowing a student’s intellectual capacity provides limited information for intervention • What do you do when faced with a “bright” student who is not doing well?
Context for Development II • There are behaviors associated with learning. What behaviors do you think are associated with learning? • Some of them are as follows: • Listening attentively • Participating in classroom activities • Accepting correction • Sticking to tasks until completed • Working to please teacher
Context for Development III • There is evidence that these learning behaviors are teachable. • Idiographic data is useful in this arena, but time-consuming to gather • We did not have good nomothetic data on learning behaviors. • However, we know that school teachers are relatively accurate, reliable, unobtrusive, cost-beneficial observers of classroom behavior, when they have had ample opportunity to observe.
Context For Development IV • In light of the previous information, the authors of the LBS set out to develop a scale to measure learning behaviors reliably and validly in 5 - 17 year olds, using teacher observation. • The research work on the LBS started in the mid 1980s and the scale was published in 1999.
Preliminary Research • Examined • Reliability of subscale scores and total score in small samples. • Validity of subscale and total scores in small samples. • Created scale that worked well.
US Standardization • Sample • 1,500 students, 750 males and 750 females 5 to 17 years old • Used 1992 U.S. Census to obtain demographics • Blocking for sex, age, grade in school • Stratified random sampling by race, class, family structure, community size, and geographic region
Final Norm Sample • Race: 67.7% White, 15.9% Hispanic, 12.1% African American, 4.3% other groups. • Family: 76.6% with two parents or guardians, 21.3% single mom, 2.1% single dad. • Representation by SES based on parent education, and exceptionality • Final selection was randomly selected from those who gave consent, restricted only by stratification quotas and ≤ 2 students per teacher.
Test Retest Reliability (n = 77) • Competence Motivation .92 • Attitude Toward Learning .91 • Attention/Persistence .92 • Strategy/Flexibility .93
Inter Rater Reliability (n = 72) • Competence Motivation .83 • Attitude Toward Learning .83 • Attention/Persistence .83 • Strategy/Flexibility .83
T & T Sample • The LBS was completed on all 700 students in the sample, with no rater missing more than 2 items. • The distribution was skewed toward the higher end--that is, most students were rated as having learning behaviors in the normal range.
Factor Analyses • As is recommended, we used factor analysis to look at the structural validity of the LBS in the T & T sample. • We used multiple criteria to determine how many factors would work best. • The goal was to find a factor structure that was generalizable across the whole sample, as well as the gender subgroups.
Factor Analyses 2 • In the US, the LBS is made up of four factors. • We ran five factor, four-factor, three-factor, and two-factor models. • The only structure that generalized from the whole sample across gender groups was the two-factor one (see p. 8 in manual and note pattern coefficients).
Factor Analyses 3 • Factor I consists of 18 items and is labeled Attitude Toward Learning (AL). The items on this factor made up the Competence Motivation, Attention-Persistence, and Attitude Toward Learning subscales in the U.S. structure. • Factor II, labeled Strategy Flexibility, consisted of the 7 SF items in the U.S. norming, but of 9 items in Trinidad. • The AL and SF factors have two items in common (10 & 14).
Reliability and Validity Evidence • Reliability estimates for scores on the total scale were consistently high across all subgroups. • Reliability estimates for subscale scores were very high for Factor 1 and moderate for Factor II. • No reliability estimates fell below .75. • There were no statistically significant differences between genders, among ethnic groups, or among grade levels.
Administration • Speak to teacher who has seen students for at least 6 school weeks or 30 days. • Ask teacher to rate the student as accurately as possible. • Let the teacher know that this information will help in your assessment of the student. • Teacher should rate all responses. • Will require 5 to 10 minutes to complete.
Scoring • Use scoring template to complete raw score for each dimension. • Raw scores for Factor 1 (AL) range from 0 to 36. • Raw scores for Factor II (SF) range from 0 to 18. • Raw scores on Total Scale range from 0 to 54. • Put raw scores in boxes on Score Summary sheet. • Convert raw scores to %tiles using table on p. 10. • Always double check your scoring.
Interpretation I • Scores on the LBS should be only one part of a broader psychoeducational evaluation. • Higher scores represent the presence of more learning behaviors. • Students who obtain scores at or above the 40th percentile are displaying learning behaviors at or above the average range.
Interpretation II • Students whose learning behaviors are between the 20th and 40th percentiles are students who may benefit from interventions aimed at increasing their learning behaviors in general. • Students whose scores fall below the 20th percentile are manifesting deficits in learning behaviors and may benefit from immediate interventions.