Download
1 / 31
310 likes | 440 Views
Death by a Thousand Cuts. Lost rights and privileges: Academic Freedom (TT faculty replaced by NTTs) FRGs (Faculty Research Grants) Diminished start-up funds Office/work space Defined pension benefits (as of 2012) Travel funds Physical library books

E N D
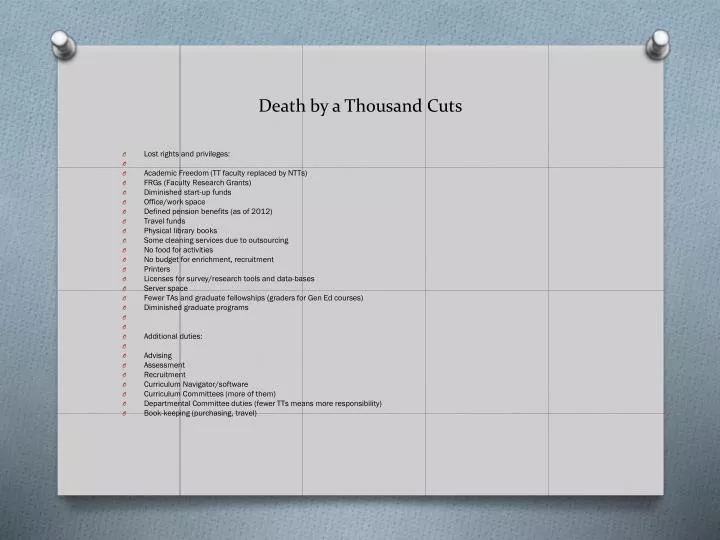
Death by a Thousand Cuts • Lost rights and privileges: • Academic Freedom (TT faculty replaced by NTTs) • FRGs (Faculty Research Grants) • Diminished start-up funds • Office/work space • Defined pension benefits (as of 2012) • Travel funds • Physical library books • Some cleaning services due to outsourcing • No food for activities • No budget for enrichment, recruitment • Printers • Licenses for survey/research tools and data-bases • Server space • Fewer TAs and graduate fellowships (graders for Gen Ed courses) • Diminished graduate programs • Additional duties: • Advising • Assessment • Recruitment • Curriculum Navigator/software • Curriculum Committees (more of them) • Departmental Committee duties (fewer TTs means more responsibility) • Book-keeping (purchasing, travel)
Introduction • The purpose of this report is to initiate a reconstruction and redirection of the educational priorities of the UMKC. The upper administration at UMKC has, we believe, followed the “best practices” of contemporary educational administration. As a result we have experienced a “creeping normalcy” leading to an educational philosophy and practices incongruent with quality education. Creeping because over the years the changes have been gradual, normal because we become accustomed to the changes and don’t notice how much things have changed. A few examples We once had a faculty/student/administration joint committee to allocate student computer fees, now it is governed by upper administration, a School of Biological Sciences was created by reassigning A&S Biology and Chemistry faculty leaving the College without a Biology department, faculty once could count on travel funds from the office of research, a new set of general education requirements was created with little in support for implementation, two new colleges, without new faculty resources, have been created, a new advising system has been implemented with very little faculty input, and finally when I arrived here the administration of the university was all housed in Scofield Hall; It’s grown some. • We believe there are adjustments needed. The list is significant but it begins with changing the current nexus between governance and administration. Creation and delivery of curriculum, programs and measures for student success, and all else curricular, should be the duty, responsibility and right of the faculty. The duty of administration is to procure resources necessary to faculty and students and aid in their organization and administration. Over the years a “new normalcy” has crept into this process. Therein we believe lie the problems we seek to resolve. • The quality of student education is fundamentally due to the quality of the faculty. High faculty quality depends mostly on the commitment of full time faculty. We assert it is time for our faculty, the bedrock of higher education, to reclaim control of our university. It is our duty and right to seek adjustments in the policies necessary to do this. What follows is our initial effort to explain the “creeping normalcy” and to understand its consequences.
BibliographyCritical Research on Higher Education • Anstine, Jeff. “Graduation Rates at U.S. Colleges and Universities: A Large Data Set Analysis.” Business Education and Accreditation, Vol 5 (2), 2013, pp. 55-64. • Armstrong, E. and Hamilton, L. Paying for the Party. Harvard University Press, 2013. • Bowen, William, et al. Crossing the Finish Line. Princeton University Press, 2009. • Cross, J. and Goldenberg, E. Off-Track Profs: Non-Tenured Teachers in Higher Education. MIT Press, 2009. • Damast, Alison, “The Out-of-State Solution to College Budgets.” Businessweek, 9/8/2011. • Ginsberg, B. The Fall of the Faculty: The Rise of the All-Administrative University and Why it Matters. Oxford University Press, 2013. • Giroux, H. Neoliberalism’s War on Higher Education. Haymarket Books, 2014. • Harrington, C. and Schibik, T. “Caveat Emptor: Is there a Relationship Between Part-Time Faculty Utilization and Student Learning Retention?” Association for Institutional Research Professional File, Vol 91, 2014. • Kezar, A., Maxey, D., Badke, L. “The Imperative for Change.” The Delphi Project on the Changing Faculty and Student, 2013. • Kezar, A. and Gehrke, S. “Why Are We Hiring so Many Non-Tenure-Track Faculty?” Association of American Colleges and Universities, Vol. 100 (1), 2014. • Marcus, Jon. “New Analysis Shows Problematic Boom in Higher Ed Administrators.” New England Center for Investigative Reporting, 2/6/2014. • Schibik, T. and Harrington, C. “The Outsourcing of Classroom Instruction in Higher Education.” Journal of Higher Education Policy and Management, Vol. 26 (3), 2004, pp. 393-400. • Smith, Curtis. “The Impact of Part-Time Faculty on Student Retention: A Case Study in Higher Education.” Doctoral Dissertation, Univ. of Missouri, Kansas City, 2010. • Wang, Marian. “Country Club Campuses.” Propublica 11/11/2013.
National Research Highlights • By 2005 there was a 48% increase in the percentage of part-timers at Universities nationwide (National Center for Educational Statistics) • By 2009, non-tenured faculty accounted for “approximately 70 percent of the faculty providing instruction at nonprofit institutions nationwide” (Assoc. of the Governing Boards of Univ. and Colleges, May/June 2013). • By expanding the number of NTT (non-tenured) positions the faculty to student ratio has remained fairly stable since 1975 (16 %). But, the number of students for every administrator or staffer has gone down—from 1 for every 84 in 1975 to 1 for every 58 in 2005 (National Ctr for Ed Stats). • “In all, from 1987 until 2011-12…universities and colleges collectively added 517,636 administrators and professional employees, or an average of 87 every working day” (Marcus 2014). • As of 2009 only 44 % of entering students were graduating college (Bowen 2009). • Dominant variables determining graduation rates: classroom size, faculty salaries, and workplace conditions (Anstine 2013).
CAS Departments: 18 total—16 responded • Part One • Net Loss of FT and FTE Faculty (not replaced) in the past 3 years: Total 31 • Psychology 4 • Geosciences 2 • Economics 2 • CJC 0 • AUPD 0 • Sociology 3 • Social Work 3 • Theater 2 • History 4.5 (FTE) • Comm Studies 1 • Math 3 • Philosophy 3 • Foreign Lang 0 • Physics 0 • Art 0 • English 4 (NTT) • Chemistry ? • Political Science ?
Do you have adequate resources? Is faculty morale low? • Psychology: less funding for doctoral students causing financial stress. Low morale? “Yes.” • Geosciences: “We are near the breaking point.” Low morale? “Absolutely.” • Econ: Faculty are teaching overloads. Low moral? “Absolutely.” • CJC: “Barely” making due; faculty getting accustomed to “making due with less” • AUPD: “We are on an unsustainable level of demands.” Low morale? “Yes.” • Sociology: Unable to meet demands. Low morale? “Yes.” • Social Work: “Its getting harder to keep Dept. in the black. E&E is killing us” Low morale? “Of course.” • Theater: “we are being forced to shrink our MFA program.” Low morale? “ABSOLUTELY!” • History: “ScH #’s are in decline because of the loss of faculty.” Lost two programs (Am Studies and Rel Studies). Low morale? “I don’t think any faculty…is happy....” • Comm Studies: “We need more faculty.” Low morale? “Very much so.” • Math: “We are desperately in need of more math faculty.” Low morale? “It appears to be.” • Foreign Lang: Need a new Spanish hire to accommodate growth. Low morale? Yes. • Physics: Quality has declined in order to meet current demands. “Yes, faculty morale has suffered substantially. It is much harder to mobilize faculty to volunteer. Initiatives are received with resentment.”
Salary Levels • With the exception of CJC and Art, all Departments that looked at the national averages of comparator institutions and programs report salaries below the average to varying degrees. • From one Dept. Chair: • “Administrative salaries are too high in relation to faculty compensation. The administrative positions tend to turn over and with each new administrative hire the salary increases. The argument that we hear is that they are within the national norm. That national norm seems not to apply to faculty and staff salaries. Titles have exploded…and appears to be the method used to promote and compensate administrative staff at a higher rate than the rest of the university. Need to remember—these people DO NOT GENERATE INCOME. The shifting of titles and responsibilities has been a game of hiding salary increases in the administrative ranks. No accountability of the administration to the College or the departments. Even though they are here to support us.
Work Loads • Class-size increase? Yes. Some Depts. report increases in some classes, but not all. Full exception (experiencing declining enrollment) is History while class size is steady for Theater and Social Work. • Teaching loads? NTT loads are creeping up. Individual faculty are absorbing overloads. More invisible forms of overload like independent work and internships going up. AUPD has always absorbed an overload. History anticipates an increase. CJC is steady; tenure-track faculty in Soc are steady; Theater and Social Work are steady. • Have faculty taken on additional tasks? Yes, with the exception of CJC and Social Work. Physics and History did not answer the question. Some Depts. specified tasks-- recruitment, advising, and assessment.
Part Two (Anonymous)Administrative support from Oak Street? • “unfavorable…decisions…result in inefficient use of the resources.” • “No, not at all: on the contrary.” • “It is unclear how ‘Oak Street Administration’ aids the department’s needs in any direct or significant way.” • “No. All I have ever heard from the Administration is that faculty spend too much time complaining and asking for resources.” • “The burdensome hoops they’ve imposed that we have to jump through to do EVERYTHING nowadays makes productivity plummet…” • “RESOUNDING NO.” • “Absolutely not.” • “…there is no direct support of the department…” • “Oak St Administrators seem very far removed from ‘boots on the ground’ realities of faculty.” • “No.” • “It’s a mix. I find some of the support groups in Student Affairs actually make my job more difficult....” • “Perhaps.”
Budget Model/Misallocation of Resources? • “I get the impression that the College has been given the short end of the stick…” • “This budget model has promoted a ‘multiversity’ rather than a ‘university’….There is a severe misallocation of resources…” • “I have no way to tell…” • “Yes.” • “The model definitely improperly distributes financial resources between the schools.” • “Yes, most definitely!” • “…benefits initially purported by the budget model have not come to fruition in my department or college.” • “Absolutely. It has turned the College of A&S into a fiscal mess…” • “Yes.” • “Yes—The budget model pits schools and colleges against one another.” • “Absolutely. The Budget Model is a passive-aggressive mechanism to re-allocate funding into Health Sciences at the expense of the College….The College is being turned into a service unit.” • “Very much so.”
Adequate staffing and administrative support? • “Absolutely Not” • “No—The breadth of what faculty are expected to do has exploded exponentially. Recruitment and development…falls on the faculty. No one else is doing this work. Not an efficient use of faculty time—expensive in fact!” • “Almost.” • “No. We are…woefully understaffed.” • “…current staffing levels do not support growth.” • “…we are very concerned with the talk of ‘sharing staff’ at UMKC, which would be disastrous if implemented for us.” • “No.” • “No…our request for a replacement AA…was denied….”
UMKC Data from the US Dept. of Education, Integrated Postsecondary Education Data System (IPEDS) http://nces.ed.gov/ipeds/ http://highereddata.aft.org/
Instruction “Expenditures of the colleges, schools, departments, and other instructional divisions of the institution and expenditures for departmental research and public service that are not separately budgeted are included in this classification. Also included are expenditures for both credit and noncredit activities. Expenditures for academic administration where the primary function is administration (e.g., academic deans) are excluded. The instruction category includes general academic instruction, occupational and vocational instruction, special session instruction, community education, preparatory and adult basic education, and remedial and tutorial instruction conducted by the teaching faculty for the institution's students.” Source: Source: Higher Education Data Center, highereddata.aft.org
Research “This category includes all funds expended for activities specifically organized to produce research outcomes and commissioned by an agency either external to the institution or separately budgeted by an organizational unit within the institution. Non-research sponsored programs are not reported.” Source: Source: Higher Education Data Center, highereddata.aft.org
Public Service “Funds budgeted specifically for public service and expended for activities established primarily to provide noninstructional services beneficial to groups external to the institution are reported. Examples are seminars and projects provided to particular sectors of the community. Include expenditures for community services and cooperative extension services.” Source: Source: Higher Education Data Center, highereddata.aft.org
Academic Support “This category includes expenditures for the support services that are an integral part of the institution's primary mission of instruction, research, or public service. Expenditures for libraries, museums, galleries, audio/visual services, academic computing support, ancillary support, academic administration, personnel development, and course and curriculum development are included. Expenditures for veterinary and dental clinics if their primary purpose is to support the institutional program are included.” Source: Source: Higher Education Data Center, highereddata.aft.org
Student Services “Funds expended for admissions, registrar activities, and activities whose primary purpose is to contribute to students' emotional and physical well-being and to their intellectual, cultural, and social development outside the context of the formal instructional program. Examples are career guidance, counseling, financial aid administration, and student health services (except when operated as a self-supporting auxiliary enterprise). The administrative allowance for Pell Grants is included.” Source: Source: Higher Education Data Center, highereddata.aft.org
Institutional Support “Expenditures for the day-to-day operational support of the institution, excluding expenditures for physical plant operations. Expenditures for general administrative services, executive direction and planning, legal and fiscal operations, and public relations/development are included.” Source: Source: Higher Education Data Center, highereddata.aft.org
Operation & Maintenance of Plant “Expenditures for operations established to provide service and maintenance related to grounds and facilities used for educational and general purposes. Also included are expenditures for utilities, fire protection, property insurance, and similar items. Expenditures made from the institutional plant funds account are not included.” Source: Source: Higher Education Data Center, highereddata.aft.org
Executive, Administrative, Managerial “A primary function or occupational activity category used to classify persons whose assignments require management of the institution, or a customarily recognized department or subdivision thereof. . . . Included in this category are employees holding titles such as: top executives; chief executives; general and operations managers; advertising, marketing, promotions, public relations, and sales managers; operations specialties managers; administrative services managers; computer and information systems managers; financial managers; human resources managers; purchasing managers; postsecondary education administrators such as: presidents, vice presidents (including assistants and associates), deans (including assistants and associates) if their principal activity is administrative and not primarily instruction, research or public service, directors (including assistants and associates), department heads (including assistants and associates) if their principal activity is administrative and not primarily instruction, research or public service, assistant and associate managers (including first-line managers of service, production and sales workers who spend more than 80 percent of their time performing supervisory activities); engineering managers; food service managers; lodging managers; and medical and health services managers.” Source: Source: National Center for Education Statistics, Glossary, http://nces.ed.gov/ipeds/glossary/
AAUP Analysis of UMKC Spending Spring 2014 Distributed in AAUP Faculty Advocate 28. Revised data from Vice Chancellor Lindenbaum in response to publication of Faculty Advocate 27.