Download
1 / 41
410 likes | 494 Views
North East Green Barometer Public Attitudes Survey April 2010. Energy Saving Trust and Climate NE. Contents. Methodology. A robust survey of 1,468 adults aged 18+ across the North East of England

E N D
North East Green Barometer Public Attitudes SurveyApril 2010 Energy Saving Trust and Climate NE
Methodology • A robust survey of 1,468 adults aged 18+ across the North East of England • A representative quota (‘random location’) sample was interviewed across 76 Output Areas, with quotas set by age, gender and work status • The sample is structured to ensure 100 interviews in each local authority with boosters in: • Middlesbrough (extra 35 interviews • Redcar & Cleveland (+33) • Stockton-on-Tees (+52) • Fieldwork undertaken between 4th March and 2nd April 2010 • Data is weighted to reflect each local authority
Executive summary “The findings are encouraging and show that people in the North East are committed to be as environmentally friendly as possible. But there is no doubt that climate change is the greatest environmental challenge facing the world today so it is critical this momentum continues and increases.” – Adrian Hilton, Climate NE • Current lifestyle & the environment • When asked to describe how they feel about their current lifestyle and environment two thirds (65%) of people in the North East say they are happy with what they are doing at the moment. However, a fifth (21%) would like to do a bit more and 7 per cent would like to do a lot more. • Over two fifths (44%) of the population state that they are environmentally friendly in everything or most things they do. Just 4 per cent of people do nothing which is environmentally friendly. • Using the results to create an attitudes’ segmentation it is evident that the North East has more ‘committed’ people than the UK as whole (20% versus 13%). Similarly, the North East has more ‘fully engaged’ residents than the country overall (25% compared to 13%). Just 13 per cent people are classified as ‘disengaged’.
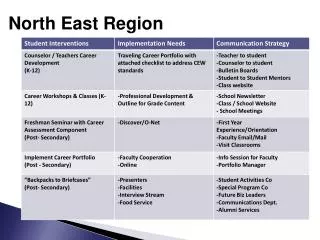
Executive summary • Efforts of local authorities to reduce carbon emissions • When asked about a number of possible measures being taken by their local authority to reduce carbon emissions, people in the North East are most likely to say their council has promoted waste reduction and recycling services (70%) and insulation schemes (60%) followed by encouraging and helping residents in their local area (53%). • On the other hand, local authorities are perceived to be less likely to be reducing carbon emissions in their own operations such as buildings and transport although this proportion (37%) is still twice the percentage (16%) who say their local council has made no effort. • Local consultation on the environment • Three fifths (62%) of people in the region are in favour of some form of local consultation in order to help reduce peoples impact on the environment. Opinion surveys, feedback forms in council publications and regular public meetings are the preferred methods. • Among those who would like to receive information there is a strong demand for details on smart meters and waste energy in the house. However, half (48%) of the population do not want any of the types of information suggested.
Executive summary • Attitudes towards carbon emissions • Encouragingly, more people are concerned than are not concerned about the impact of local industry on carbon emissions in their area (46% vs 30%). • Just over a third (36%) believe local industry is doing something to reduce carbon emissions although as many as two fifths (44%) do not have an opinion. • Making properties environmentally friendly • Two thirds of people have either improved insulation generally around windows and floors (67%) and topped up or replaced loft insulation (65%) to make their property more environmentally friendly. Slightly fewer have replaced an old boiler (55%) while just 1 per cent households have put in renewable energy. • Two thirds (66%) of homes built before between 1930 and 1980 have had cavity wall insulation put in. But, among those whose home was built before 1930, just a tenth (10%) of people have insulated their property with solid brick walls. • Over three fifths (63%) of the population say they use public transport or cycle instead of the car for local journeys. A higher proportion – 89% - state that they have cut back on what they throw away such as clothes or food.
Two thirds of people in the North East are happy with their current lifestyle and the environment Q1. Which of these best describes how you feel about your current lifestyle and the environment?Base: All NE respondents (1,468).
Just 4 per cent of the population in the North East do not do anything which is environmentally friendly 44% Over two fifths of people in the North East state that they are environmentally friendly in everything or most things they do Q2. Which of these best describes your current lifestyle?Base: All NE respondents (1,468).
Those living in Northumberland tend to be most environmentally friendly Q2. Which of these best describes your current lifestyle?Base: All NE respondents (1,468).
There are more committed people in the North East than across the country Segmentation. Base: All NE respondents (1,468). UK Source: Energy Saving Trust, 2,009 UK interviews
Segmentation by local authority – Northumberland residents are the most committed Segmentation. Base: All NE respondents (1,468). UK Source: Energy Saving Trust, 2,009 UK interviews
The majority of people believe local councils are encouraging and helping local residents to reduce carbon emissions Overall, in encouraging and helping residents in the local area Q3A. How much do you think your local authority is doing to reduce carbon emissions: Overall, in encouraging and helping residents in this local area?Base: All NE respondents (1,468).
Nearly half of people do not know whether local councils are making an effort to reduce emissions in their own operations In its own operations, for example, its energy use in its buildings and transport Q3B. How much do you think your local authority is doing to reduce carbon emissions: In its own operations, for example, its energy use in its buildings and transport?Base: All NE respondents (1,468).
Three fifths of the population of the North East have think their local council is promoting council insulation schemes Promoting insulation schemes Q3C. How much do you think your local authority is doing to reduce carbon emissions: Promoting insulation schemes?Base: All NE respondents (1,468).
By a margin of 2 to 1, local authorities are credited with making an effort to reduce carbon emissions by promoting renewable energy schemes Promoting renewable energy schemes Q3D. How much do you think your local authority is doing to reduce carbon emissions: Promotion renewable energy schemes?Base: All NE respondents (1,468).
Close to half of the public in the North East say their local council is making an effort to promote greener forms of transport Promoting greener transport schemes, for example, cycling routes, car sharing Q3E. How much do you think your local authority is doing to reduce carbon emissions: Promoting greener transport schemes, for example, cycling routes and car sharing?Base: All NE respondents (1,468).
Most people credit their local council with promoting waste reduction and recycling schemes in order to reduce carbon emissions by Promoting waste reduction and recycling schemes Q3F. How much do you think your local authority is doing to reduce carbon emissions: Promoting waste reduction and recycling schemes?Base: All NE respondents (1,468).
Opinion surveys, feedback forms in council publications and regular public meetings are preferred methods of consultation 62% Three fifths of people in the North East mention at least one method of consultation Q4. Which, if any, of the following methods of local consultation would you like to see in order to help reduce peoples impact on the environment? Base: All NE respondents (1,468)
Those living in County Durham are much less interested than the population as a whole in methods of local consultation Q4. Which, if any, of the following methods of local consultation would you like to see in order to help reduce peoples impact on the environment? Base: All NE respondents (1,468)
There is a strong demand for more information on smart meters and waste energy in the house 43% 2/5ths of people in the North East would like to receive information on at least one of the following Q7. Would you like to receive information on any of the following? Base: All NE respondents (1,468)
More people are concerned than are not concerned about the impact of local industry on carbon emissions in their local area NET: Concerned: 46% Q8. How concerned, if at all, are you about the impact local industry has on carbon emissions in the local area? Base: All NE respondents (1,468).
People in Hartlepool, Stockton-on-Tees, Middlesbrough and Sunderland are most concerned about the impact on local industry on carbon emissions Q8. How concerned, if at all, are you about the impact local industry has on carbon emissions in the local area? Base: All NE respondents (1,468).
Just over a third of the population believe local industry is doing something to reduce its carbon emissions NET: Made an effort: 36% Q9. How much do you feel local industry is doing to reduce its carbon emissions? Base: All NE respondents (1,468).
The proportion believing local industry is doing something to reduce its carbon emissions rises to over half among residents in Middleborough and Sunderland Q9. How much do you feel local industry is doing to reduce its carbon emissions? Base: All NE respondents (1,468).
Local consultation on the environment Making properties environmentally friendly
Views on measures to make properties more environmentally friendly Regional summary Q5. Which of the following best describes your views on each of these measures intended to make properties more environmentally friendly. Base: Statements A, D, E, F: All respondents (1,468). Statement B: All whose home was built between 1930 & 1980 (923). Statement C: All whose home was built before 1930 (276)
Views on measures to make properties more environmentally friendly Topping up or replacing loft insulation Q5A. Which of the following best describes your views on each of these measures intended to make properties more environmentally friendly? Base: All NE respondents (1,468).
Views on measures to make properties more environmentally friendly Putting in cavity wall insulation Caution: small base sizes Q5B. Which of the following best describes your views on each of these measures intended to make properties more environmentally friendly? Base: All NE respondents whose home was built between 1930 and 1980 (923).
Views on measures to make properties more environmentally friendly Caution: very small base sizes – indicative only Insulating old properties with solid brick work Q5C. Which of the following best describes your views on each of these measures intended to make properties more environmentally friendlyBase: All NE respondents whose home was built before 1930 (276)
Views on measures to make properties more environmentally friendly Improving insulation generally around windows and floors Q5D. Which of the following best describes your views on each of these measures intended to make properties more environmentally friendly? Base: All NE respondents (1,468).
Views on measures to make properties more environmentally friendly Replacing an old boiler Q5E. Which of the following best describes your views on each of these measures intended to make properties more environmentally friendly? Base: All NE respondents (1,468).
Views on measures to make properties more environmentally friendly Putting in renewable energy Q5F. Which of the following best describes your views on each of these measures intended to make properties more environmentally friendly? Base: All NE respondents (1,468).
Three fifths of the population use public transport or cycle instead of the car for local journeys. Nine in ten people cut back on what they throw away Q6. Which of the following best describes your view of each of these environmentally friendly measures: A. Using public transport or cycling for local journeys instead of the car? B. Cutting back on what you throw away, for example, clothes or food? Base: All NE respondents (1,468).
Newcastle residents are most likely to use public transport or cycle instead of the car for local journeys % using public transport or cycling for local journeys instead of the car Q6A. Which of the following best describes your view of each of these environmentally friendly measures: Using public transport or cycling for local journeys instead of the car?Base: All NE respondents (1,468).
Nine in ten people cut back on what they throw away % cutting back on what people throw away e.g. clothes or food Q6B. Which of the following best describes your view of each of these environmentally friendly measures: Cutting back on what you throw away, for example, clothes or food?Base: All NE respondents (1,468).