Download

1 / 41
430 likes | 685 Views
R Graphics. Dr. Yan Liu Department of Biomedical, Industrial and Human Factors Engineering Wright State University . Introduction to R. What is R A free “open-source” system for statistical computation and graphics

E N D
R Graphics Dr. Yan Liu Department of Biomedical, Industrial and Human Factors Engineering Wright State University
Introduction to R • What is R • A free “open-source” system for statistical computation and graphics • Consists of a language (called R) plus a run-time environment with graphics, debugger, access to certain system functions, and the ability to run programs stored in script files • Influenced by S language, developed by Becker, Chamber, and Wilks at Bell Laboratories • S is a very high level language and an environment for data analysis and graphics • S-Plus, a commercial tool • Initially written by Ross Ihaka and Robert Gentleman at the Department of Statistics of the University of Auckland in Auckland, New Zealand • Possible for the user to interface to procedures written in the C, C++, or FORTRAN languages for efficiency • Main Website of R • Http://cran.r-project.org/ (download Linux, MacOS X, and Windows)
Start Up “run line or selection” button Script File Window Command Window • Two Alternatives to Run Commands in R • Command window (R Console window) • Script file (File >> New script) • Highlight the commands in the script file window and click the “run line or selection” button
Read Files Read in Data from an External File Parameters: file = “ …” the name and directory of the file from which the data are to be read header = T the first row in the table of data includes the attribute names of the data sep = “…” the field separator character. (“\t” – means separation by tab; other common separators include “,” “;” and “ ”) na.strings = “…” specify the missing characters, which is NA by default read.csv( ) is identical to read.table except for the defaults. It is intended for reading ‘comma separated value’ files (‘.csv’)
Characteristics of Dataset > names(auto): returns the attribute names of “auto” dataset > str(auto): returns the attribute names of “auto” dataset and a short description of each attribute and the dataset
Basic Attribute Types • Numeric • Real numbers • Integer • Logical • Binary: true or false • Character/Strings • e.g. “red”, “green” • Factor • Categorical attribute whose values are stored as a vector of integers in the range [ 1... k ] (where k is the number of unique values in the nominal variable) • e.g. In attribute country: 1 - USA, 2 – European, 3 – Japan • An ordered factor is used to represent an ordinal variable • e.g. In attribute size: 1 - small, 2 – medium, 3 – large
Convert Attribute Type • as. numeric(x) • Convert an attribute to numeric • as. integer(x) • Convert an attribute to integer • as. factor(x) • Convert an attribute to factor • toString(x, width=…) • Convert an attribute to characters/strings
R Objects • Scalar • A single value • Vector • A one-dimensional array of arbitrary length > c(2, 3, 5, 2, 7, 1) > 3:10 > c(“Canberra”, “Sydney”, “Newcastle”) • All elements of the vector must be of the same type (e.g. numerical, character, etc.) • Subsets of the vector may be referenced > x <- c(2, 3, 5, 2, 7, 1) > x[c(2,4)] #extract elements 2 and 4 of x > x[-c(2,4)] #extract elements of x except elements 2 and 4
R Objects (Cont.) True: fill by rows False: fill by columns number of columns number of rows The first two elements at the 1st row The elements at the first two columns • Matrix • A two-dimensional array with an arbitrary number of rows and columns • All elements of the matrix must be of the same type • Subsets of the matrix may be referenced • Individual rows and columns of the matrix may be handled as vectors
R Objects (Cont.) • Array • As a matrix, but of arbitrary dimension • Data Frame • A dataset with rows (representing data records) and columns (representing attributes) • May be handled similarly to a matrix • Individual columns of the data frame may be handled as vectors
R Objects (Cont.) • Quit Function: q() • On quitting, R offers the options of saving the workspace image, in the file .RData in the working directory • Remove Object Function: rm() • Remove objects that are no longer needed • Function • R has a vast number of `built-in' functions • e.g. mean( ), plot( ), var( ), etc. • Users can write their own functions • List • An arbitrary collection of other R objects (which may include other lists)
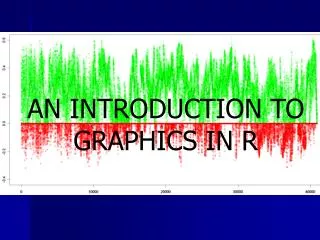
A Simple Scatterplot plot (auto$mpg, auto$horsepower) produces a scatterplot of mpg vs. horsepower of the auto dataset */ text(40, 200, “Plot of mpg vs. horsepower”) adds the label at the location (40, 200) within the plot
Overview of R Graphics • Graphics Functions • High-level functions that produce complete plots • Some flexibility in the way that the data to be plot can be specified • e.g. plot( ) • Low-level functions that add some outputs to existing plots • e.g. text( ) • Functions for working interactively with graphical outputs • “Painters Model” • Graphics output occurs in steps, later output obscuring any previous output that it overlaps
Trellis Plots Provided through package Lattice Embody a number of design principles proposed by Bill Cleveland (1987, 2004) that aim to ensure effective visualization Trellis Display
When there are many overlapping points, we can make points semi-transparent to mitigate the overlapping issue Where the color is "#RRGGBBAA" and the AA portion is the opacity/trasparency
Special-Purpose Plots • R provides a set of functions for producing graphical output primitives (e.g. lines, text, rectangles, polygons, etc.) which users can use to create plots with special purposes
Graphical Output Formats # A PDF file of the plot will be saved in the same directory as that of the R workspace • When using R interactively, the result is a plot drawn on screen • Can be saved as a PDF, postcript, or image file File > Save as > Postcript…/PDF…/Png… (a desired format) • Can produce a file that contains the plot • Output is directed to a particular output device which indicates the output format postscript( )for Adobe PostScript file, pdf( ) for Adobe PDF file, pictex( ) for LaTex PicTex file, png ( ) for PNG bitmap file, jpeg( ) for JPEG bitmap file, bmp( ) for Window BMP file • Close a device dev.off ( )
Structure of the R Graphics System • Core Graphics Systems • Graphics (traditional graphics) • Grid • Lattice package is built on Grid • Graphics Engine & Devices • grDevices package consists of functions that provide support for handling colors and font Structure of the R Graphics System (Showing the main packages that provide graphics functions in R. Arrows indicate where one package builds on the functions in another package)
Traditional versus Grid Graphics Systems • High-Level Functions • The traditional system, or the graphics package built on the top of it, provide the majority of the high-level functions currently available in R • Lattice package, built on the Grid system, provides high-level functions • Low-Level Functions • Both provide many low-level functions • Functions for Interaction • Traditional system provides very limited interaction • Grid system provides functions for interacting with graphical outputs • Editing, extracting, deleting parts of an image • Graphics Design • Trellis plots have a better design in terms of visually encoding information (based on research on human visual perception)
Lattice Graphics Model • Lattice Plot Types • A number of standard plot types (like those in the traditional graphics) • More modern and specialized plots • A table of comparison of plot functions of lattice and traditional graphics systems can be downloaded from the course website • A Lattice graphics function produces an object of class “trellis” which contains description of the plot The following two sets of functions produce the same plot (1) (2) • Possible to work with the trellis object and modify it using the update() function for trellis objects Loading Lattice into R
Trellis Display: xyplot • xyplot(y~x|g1,g2,…, data, …) produces a scatterplot of y (on vertical axis) versus x (on horizontal axis) conditioning on g1, g2, … • Create shingles for conditioning variables with continuous values • A shingle is a data structure that consists of a numeric vector along with some possibly overlapping intervals • equal.count(x, number, overlap) • Create a shingle that consists of intervals with (almost) the same number of data records • x: the variable to be shingled; number: the number of intervals; overlap: the overlapping between successive intervals (as proportion to the number of records in each interval)
Trellis Display: 3D Scatterplot cloud(z~x*y|g1,g2,…, data, …) produces a 3D scatterplot of z (on vertical axis) versus x and y (on horizontal grid) conditioning on g1, g2, …
Parallel Coordinates Parallel(x, data, …) produces a parallel coordinates of data frame x
Parallel(x|g1,g2,…, data, …) produces a parallel coordinates of data frame x conditioning on g1, g2, …
R Formula • The first argument to the lattice plotting functions is usually an R formula • Common Types • y~x: plots variable y (on the vertical axis) against variable x (on the horizontal axis) • ~x: used in plots of one variable x or parallel coordinates of a data frame (matrix) x • z~y*x: plots variable z against x and y (which are on the base grid) • y1+y2~x: plots both variable y1 and variable y2 against x
Arranging Lattice Plots "The aspect ratio is vital because it has a large impact on our ability to judge rate of change. A number of studies in visual perception have shown that our ability to judge the relative slopes of line segments on a graph is maximized when the absolute values of the orientations of the segments are centered on 45 degrees.“ Bill Cleveland (http://stat.bell-labs.com/project/trellis/interview.html ) • Arrangement of Panels and Strips in a Single Lattice Plot • layout(mat, …) mat: a matrix object with up to 3 dimensions, specifying the number of the columns, rows, and pages • aspect argument: specifies the aspect ratio (height divided by width) for the panels • aspect=“fill” by default which means to make the panel to fill the available space • aspect = “xy” means the aspect ratio is calculated to satisfy the “banking to 45°”
Arrangement of Several Lattice Plots on a Single Page • First, create a trellis object for each lattice plot • Then, call print( ), supplying arguments to specify the position of each plot
Traditional: Plots of One or Two Variables plot( ) produces scatterplots
Traditional: Plots of One or Two Variables (Cont.) Specify data to be plot in plot( )
Traditional: 3D Plots persp(x, y, z, …) produces 3D surfaces with x and y as the base coordinates and z is a function of x and y
Traditional: 3D Plots (Cont.) symbols(x, y, circles, squares, rectangles, stars, thermometers, boxplots, …) uses one of the six symbols to represent the third variable
Traditional: Multivariate Plots pairs(x, …) produces a scatterplot matrix of x (a matrix or data frame)
Traditional: Multivariate Plots (Cont.) stars(x, …) produces a star plot of x
Getting Help Every R function and dataset has online help associated with it, using help( ) help(help) gives instructions on how to use help( )