Download
1 / 22
230 likes | 400 Views
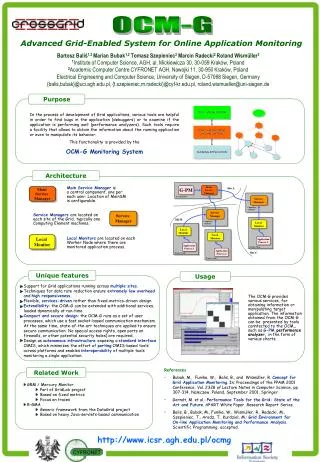
OMIS Approach to Grid Application Monitoring. Bartosz Baliś Marian Bubak Włodzimierz Funika Roland Wismueller. AGENDA. Introduction Monitoring architecture sensors (local monitors, application monitors) service managers Performance efficient data gathering

E N D
OMIS Approach to Grid Application Monitoring Bartosz Baliś Marian Bubak Włodzimierz Funika Roland Wismueller
AGENDA • Introduction • Monitoring architecture • sensors (local monitors, application monitors) • service managers • Performance • efficient data gathering • scalability of grid-scale monitoring • Producer / consumer communication protocol • Comparison to DATAGRID • Experience • Conclusion
Introduction • Need for monitoring applications • improve performance • localize bugs • For these purposes – specialized tools needed • debuggers, performance analyzers, visualizers, etc. • Tools composed of two modules • user interface • monitoring module
Introduction (cont’d) • Main issues of monitoring on Grid • scale of Grid enormous • many applications, many users, high distribution, high heterogeneity • simply porting existing environments not sufficient! • A solution: • underlying universal monitoring system • well defined interface to tools • Experience with OMIS / OCM: PVM MPI, port of tools • next step – move to Grid?
Monitoring architecture • Compliance with GMA (Grid Monitoring Architecture) • producer / consumer model • Sensors – producers of performance data • Tools – consumers of the data • Direct communication between producers and consumers • Producers located via e.g. a directory service
Sensors • Collect performance data from applications • Two types of sensors • local monitors (process sensors) • application monitors
Sensors (cont’d) • Local monitors • one per node • collect data only from processes on this node • publish themselves in the directory service • Application monitors • embedded parts of applications • collect data on various events, e.g. function calls • may improve efficiency and portability • interact with local monitors
Service managers • Tool + local monitors – one consumer, multiple producers • Intermediate entity: service manager • handles requests coming from a tool • splits them into sub-requests for local monitors • collects replies from local monitors • assembles them into a single reply for the tool • Both producer (of data for tools) and consumer (of data from local monitors) • Offers the functionality of local monitors but on a per-application basis
Application Monitors • Part of the monitoring system embedded in the application’s processes • have acces to the application address space! • Many possible usages • efficient data gathering and storing • may take over some of the local monitor’s tasks • may be used to dynamically load monitoring extensions • even more for multithreaded applications
Application Monitors – debugging example • A debugger wants to access a process’ address space • Standard system mechanisms: ptrace, /proc • /proc more powerful yet platfom-dependant • synchronous control • Via application monitors request from the debugger to access the data • portable, asynchronous • question: how to ensure that application monitors are not corrupted by the application?
Performance • Efficient data gathering • data production much more frequent than retrieval • frequency and time of access – difficult to predict • Scalability • grid-scale monitoring system • distributed vs. centralized
Efficient data gathering • Local storing • performance data first stored locally, in the context of application processes • on request, passed to local monitors • saves communication and context switches between application and local monitor processes • Efficient data structures • performance data initially preprocessed • summarized information stored in e.g. counters and integrators
Scalability • Decentralization multiple service managers instead of one • Possible approaches • fixed number of service managers, each responsible for part of the system • one service manager starting for every monitored application
Scalability (cont’d) • In the first approach • more tight cooperation between service managers will be necessary • In the second approach • local monitors must have the ability to serve multiple service managers • service managers locate local monitors via directory service
Communication protocol • Based on the OMIS specification • OMIS = On-line Monitoring Interface Specification • specification of a universal interface between tools and a monitoring system • supports various types of tools • allows for easy extending • Necessary Grid-specific extensions (e.g. for authentication)
Comparison to DATAGRID • Monitoring approach • DG: (semi-)on-line • CG: on-line • Architecture • DG: centralized distributed (local monitors and one main monitor) • CG: distributed (local monitors and multiple service managers)
Comparison to DATAGRID (cont’d) • Data collection • DG: local storing with trace buffering or counters • CG: local storing with preprocessing (counters, integrators) • Communication protocol • DG: Not specified • CG: OMIS
Experience • OMIS-based monitoring system for clusters of workstations – OCM • OMIS-based tools – PATOP (performance analysis), DETOP (debugging), others... • Local storing and efficient data structures (counters and integrators) proved to be very efficient • full monitoring overhead of about 4% • Instrumentation techniques used induce zero-overhead when monitoring inactive
Summary • Demand for accurate data from monitoring tools • Monitoring data handling: production / consumption • A general scheme of monitoring compliant with GMA • Need of an advanced monitoring infrastructure • Concepts of OMIS will be extended to fit Grid