Download
1 / 37
370 likes | 561 Views
R. Tsheko , M. Tapela, N.J. Batisani Botswana College of Agriculture Crop and Rangeland Monitoring Agriculture Service. Agenda SADC THEMA Services. Course Content Introduction Vegetation Indicies NDVI NDWI DMP VPI. 1) Introduction.

E N D
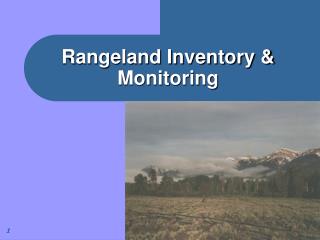
R. Tsheko, M. Tapela, N.J. Batisani Botswana College of Agriculture Crop and Rangeland Monitoring Agriculture Service
Agenda SADC THEMA Services Course Content • Introduction • Vegetation Indicies • NDVI • NDWI • DMP • VPI
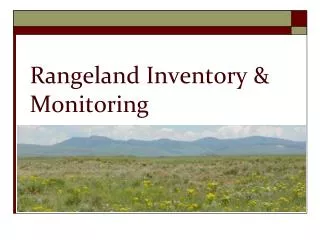
1) Introduction • Monitoring biomass through time can provide important information about the likelihood of good or poor harvest; • Moreover, it also gives information about the stability of the natural ecosystem and whether significant changes are taking place. • If the goal is to monitor biomass of vegetation, it is to collect satellite data at the height of the growing season when the biomass produced is at maximum.
1) Introduction • The primary remote sensing derived products used for monitoring agriculture are namely the rainfall and vegetation products. • Rainfall products are derived from local observations and satellite remote sensing products while vegetation products are mainly NDVI products derived from geostationary meteorological and other polar orbiting satellites. • Moreover, it also gives information about the stability of the natural ecosystem and whether significant changes are taking place.
2) Vegetation Indices NDVI: • Much of the effort put into extracting vegetation biophysical variables using remote sensing has gone into the development of vegetation indices. • These indices are indicators of relative abundance and activity of green vegetation. • Vegetation index must have the following characteristics; • maximize sensitivity to plant biological parameters, sensitive on a wide range of vegetation conditions and the index should be easily validated and calibrated; • index must be insensitive (normalized) to external effects such as sun angle, viewing angle, and the atmospheric condition to facilitate spatial and temporal comparisons;
2) Vegetation Indices NDVI: • the index must be invariant to internal effects such as canopy background variations, topography (slope and aspect), background soil variations; and • index must be coupled to some specific measurable biophysical parameter such as biomass (this allows for validation and quality control).
2) Vegetation Indices NDVI: • There are more than twenty (20) vegetation indices developed so far though most of them are functionally equivalent (redundant) in information content.
2) Vegetation Indices NDVI : • NDVI imagery is calculated from the red and near infra-red reflectances observed by the AVHRR (Advanced Very High Resolution Radiometer) sensor on NOAA meteorological satellites and SPOTVGT (1.1km res).
2) Vegetation Indices NDVI : • The NDVI image provides an indication of the vigor and density of vegetation at the surface. • Images of NDVI are sometimes referred to as "greenness maps" since they represent the vegetative vigor of plants. • The time series of NDVI data (from 1982-present- NOAA) allows analysis of changes in vegetation vigor and density in response to bio-physical conditions (including plant type, weather and soil).
2) Vegetation Indices RGB=NIR,RED,GREEN • Vegetation reflectance in the IR could discriminate it from non vegetative ‘green’
2) Vegetation Indices NDVI : • Processed by NASA and the U.S. Geological Survey, the data are represented as pixels (cells), with each pixel representing an area of 8.0 x 8.0 km. • NDVI values range between -1 and +1, with dense vegetation having higher values (e.g., 0.4 - 0.7), and lightly vegetated regions having lower values (e.g., 0.1 - 0.2). • The primary use of these images is to compare the current state of vegetation with previous time periods, for example the same time in an average year or a reference year (a particularly good or bad year) to detect anomalous conditions.
2) Vegetation Indices NDVI : • In a cropped area, NDVI values steadily increase as the season progresses (from young green healthy crops), this reaches a maximum value before falling with senescence of the plant then harvest. • The time series analysis of NDVI data provides a method of estimating net primary production over varying biomass types, of monitoring phenological patterns, and of assessing the length of the crop growing season. • NDVI values can further be used to calculate other secondary products such as Dry Matter Productivity (DMP) and Vegetation Production Index (VPI).
2) Vegetation Indices NDVI: • NDVI as a function of vegetation growth
2) Vegetation Indices NDVI : • NDVI values can also be calculated per administrative unit and/or per land cover or crop cover type. • This further enhances the product for the purpose of monitoring in specific areas and/or for specific vegetation classes or crop types. • This Regional Un-mixed Mean (RUM) statistics could then be compared with statistics commonly available from respective agricultural regions. • The status map (a product which is produced in addition to NDVI) is used to filter out contaminated pixels, this contamination is mainly due to clouds, shadow and radiometric quality of the bands used to calculate NDVI.
2) Vegetation Indices SADC GLC2000 Map Time Series NDVI analysis – Agricultural pixels
2) Vegetation Indices Time Series NDVI analysis – Agricultural pixels
2) Vegetation indices CNDV : Corine NDVI • NDVI images are converted to represent an agricultural production regional; this is achieved by computing regional NDVI means and weighting the values according to each pixels’s area occupied by the land cover type of interest (a specific crop such as maize). • The CNDVI method has been developed to extract NDVI profiles from satellite imagery. This technique aggregates NDVI information by administrative regions and also focuses on agricultural (production) areas only. The calculated CNDVI is a more appropriate indicator of crop yield (agro-statistical).
3) Vegetation indices CNDV : • Average NDVI based on the polygon for seasons 2001 to 2006
2) Vegetation indices CNDV : is an auxiliary variable used to indicate whether the pixel I has to included or rejected in the computation of the regional NDVI mean W is a relative weight for each class of interest c is the land use class (non-irrigated arable land, pastures, permanently irrigated land etc) r is the region t is the threshold surface fraction in % (0, 5, 10, 20, 30, 40, 50 and 60)
3) Vegetation Indices • Qualitative analysis of CNDVI profiles for Maize in Kenya
2) Vegetation Indices NDWI – Normalised Difference Water Index • Dimensionless index with values ranging from -1 to 1. • It can be used to indicate the presence of water in the plant tissue and within the top layer of the soil (incase the soil is bare). • It is calculated as the differences in the Near Infrared (NIR) and Short Wave Infrared (SWIR). • The SWIR reflectance shows changes in both the vegetation water content and the spongy mesophyll structure in vegetation canopies, while the NIR reflectance is affected by leaf internal structure and leaf dry matter content but not by water content. • The combination of the NIR with the SWIR removes variations induced by leaf internal structure and leaf dry matter content, improving the accuracy in retrieving the vegetation water content.
2) Vegetation Indices NDWI – Normalised Difference Water Index
2) Vegetation Indices • NDWI is a good indicator for vegetation liquid water • It is less sensitive to atmospheric scattering effects than NDVI. • Time series analysis of NDWI such as differentiating multi-temporal data sets can show evidence of water availability, water stress or drought
2) Vegetation Indices DMP • Dry Matter Product is an indicator of the increase or decrease of dry matter biomass (growth rate) expressed in kg dry matter per hectare per day. • DMP is calculated from the short wave radiation which is composed of photosyntheticaly active radiation. • Other parameters involved are the fraction absorption of this radiation by the green vegetation and the efficiency of this radiation conversion into biomass. • In the VGT Africa products, DMP is calculated from the daily temperature, daily radiation and the VGTS10 NDVI. • Most crop yield forecasting models use DMP as one of the input. The DMP values vary from 0 to 327.76 kg dry matter/ha/day.
2) Vegetation Indices • Difference of consecutive images gives us information on progression of dry matter productivity and possible vegetation growth rates during the season. • Differences in DMP images from different seasons allow the detection of anomalies in vegetation growth. • The accumulation of DMP over time provides an estimation of the final dry matter production. Regional Un-mixed Mean (RUM) statistics for DMP can be calculated per administrative unit or crop type. These statistics could then be compared to DMP statistics derived in-situ by other means. The DMP can also be used as one of the inputs of crop yield prediction models
2) Vegetation Indices VPI • The Vegetation Productivity Indicator is used to assess the overall vegetation condition and is a categorical type of difference vegetation index, referenced against the NDVI percentiles of the historical year.
2) Vegetation Indices VPI • The VPI can either be calculated based on DMP or NDVI values (cumulative histogram of long term historical data) • This product contains values ranging from 0 - 255, these include flags such as missing data, clouds, snow, sea and background pixels. • The Vegetation Productivity Indicator is used to assess the overall vegetation condition. • The VPI is classified in 5 main groups • The VPI method is a statistical distribution of the NDVI for each 10-day period of the year by applying techniques commonly used in hydrology for the prediction of extreme events. • Combination decadal VPI images produces an integrated image showing the number of occurrences where a below (or above) average normal value is registered • VPI can then be used to identify (flag) areas at risk for low agricultural production or drought
The END Thank You.