Download
1 / 18
180 likes | 496 Views
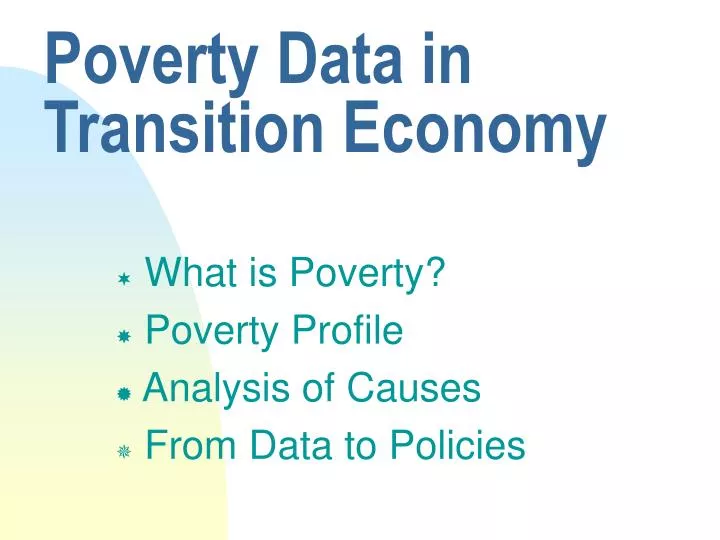
Poverty Data in Transition Economy. What is Poverty? Poverty Profile Analysis of Causes From Data to Policies. The Experience of Poverty in ECA.

E N D
Poverty Data in Transition Economy • What is Poverty? • Poverty Profile • Analysis of Causes • From Data to Policies
The Experience of Poverty in ECA • Beginning of transition, we expected poverty would increase, but be shallow and short-lived…but: poverty increased dramatically: from 2% in 1988 to an estimated 21% in 1998! • Fall in living standards in context of profound changes in political, social and economic life • Income insecurity is number one concern • Psychological pain as devastating as material hardship • Poverty difficult to discuss
What is Poverty? Poverty is multidimensional Simplest definition:poverty is the status of a person who falls short of a level of welfare deemed to constitute a minimum, either in some absolute sense or relative to the standards of a specific society. • income poor. • security poor. • education poor. • health poor. • social capital poor. Poverty is pain; it feels like a disease. It attacks a person not only materially but also morally. It eats away one’s dignity and drives one into total despair (a woman from Moldova)
Poverty line: a basic minimum. Incidence of poverty (poverty rate or headcount rate): percentage of the population that cannot afford to buy a basic basket of goods. The depth of povertymeasures how badly off the poor are — how far below the poverty line their consumption levels are. Poverty Indicators
Poverty Data: How Many Poor? Source Making Transition Work for Everyone: Poverty and Inequality in ECA; poverty lines in PPP, welfare indicator is consumption per capita.
Poverty Profile: Who is at Greatest Risk? • Households with unemployed heads • Multi-child households but NOT the elderly • Rural households • Some localized areas or regions (e.g. Northeast Romania; East Ukraine; Imereti region Georgia ). But the majority of the poor are working, and live in urban areas. Poor woman with winter food supply; rural Tajikistan
Poverty Analysis: Explaining Why the Poor are Poor • Poor are less educated (skills) - most important • Poor have less informal undeclared income (“savings”) - yes • Poor work less (labor participation) - not always • Poor receive less help [“other income”] - actually receive more help • Poor live in larger families(“mouths to feed”) -least important
Coping strategies of the poor Coping strategies • Reducing expenditures • Reducing social interaction • Selling assets • Subsistence gardening • Buying and selling • Informal sector work • Seasonal/migrant labor • Risky, quasi-legal and illegal activities Unemployed man engaged in petty trade; Armenia.
Capabilities of the Poor Endangered • Depletion of economic and social capital • Reduced school attendance for poor children, poor areas not well-served • Increasing corruption in health, education and other services hurts the poor most • Insufficient attention to nutritional deficiencies, communicable diseases My children cannot go to school because, without them, I wouldn’t be able to gather enough cardboard every day (Moldova). Poor woman with stomach cancer, Armenia. Cannot afford health care.
Why Did Poverty Increase? • Output collapse key-- but magnitude varied across region • Collapse of output experienced by households as decline in employment and wages • ….but also as a fall in social transfers (especially in CIS) • Increasing inequality also important factor Decline output Falling Wages and Incomes (especially marked in CIS).
Increases in Inequality: • Causes for sharp increase in CIS: widespread corruption and rents; capture of the state by vested interests that have influenced policy to their advantage, resulting collapse of formal wages and income opportunities.
From Analysis to Policies • The analysis should point out the areas for action (incidence analysis) • The analysis should contain simulations of the effect of policies (growth and poverty) • The analysis and the conclusions need to be validated and discussed • The agenda of public action to reduce poverty needs to be owned by actors
Stimulate labor demand and private sector environment; build capabilities of the poor Help the destitute; ensure long-run equality of opportunity for poor children; balance protection, efficiency Reduce rents;measure to aid those at bottom, lagging regions; anti-discrimination Tackle state capture; build communities; give voice Key Building Blocks • Provide conditions for shared growth • Protect the poor and vulnerable • Reduce inequality and enhance opportunities for the poorest • Build effective and inclusive institutions
Summing Up: Why Are We Measuring Poverty? • By accurately measuring poverty and establishing its profile today we can assess/ evaluate policies tomorrow - establishing a benchmark • A precise analysis of poverty characteristics is needed to assess the likely impact of future policies on different groups • Cost of measurement is low compared with benefits (even in narrow sense of just improving the targeting)
Summing Up: Steps in Poverty Analysis. • Decide what indicators to use • What data are available? Is there household survey? What survey is this? • What do we know about dimensions and dynamics of poverty? • Analyse data on poverty • Is there a poverty line? How is it defined? • Establish robust poverty profile • Multidimensionality and context-specific aspects of poverty • Interpret the numbers and trends • Data that are closely correlated with changes in poverty • Set realistic targets • Develop policy recommendations