Download
1 / 3
30 likes | 180 Views
Disguised Client Data. Publishing Example - Subscription Based. Overview and Outcome. Outcome: Tenure of new Customer attriting in First 12 m. Problem Statement

E N D
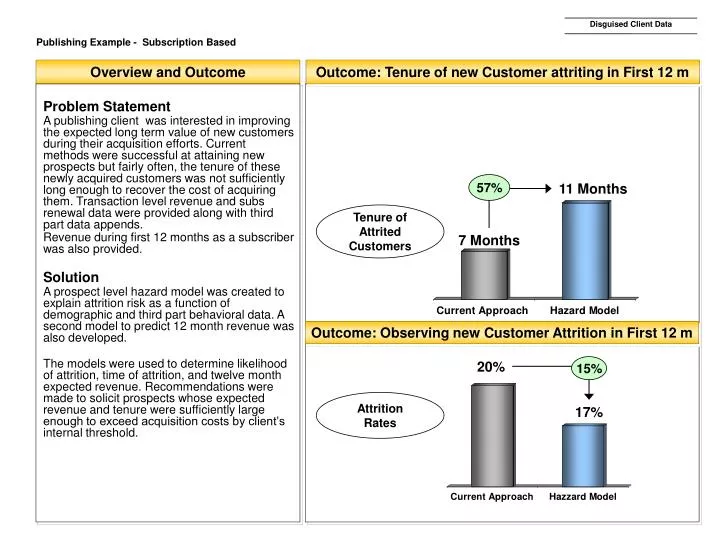
Disguised Client Data Publishing Example - Subscription Based Overview and Outcome Outcome: Tenure of new Customer attriting in First 12 m Problem Statement A publishing client was interested in improving the expected long term value of new customers during their acquisition efforts. Current methods were successful at attaining new prospects but fairly often, the tenure of these newly acquired customers was not sufficiently long enough to recover the cost of acquiring them. Transaction level revenue and subs renewal data were provided along with third part data appends. Revenue during first 12 months as a subscriber was also provided. Solution A prospect level hazard model was created to explain attrition risk as a function of demographic and third part behavioral data. A second model to predict 12 month revenue was also developed. The models were used to determine likelihood of attrition, time of attrition, and twelve month expected revenue. Recommendations were made to solicit prospects whose expected revenue and tenure were sufficiently large enough to exceed acquisition costs by client’s internal threshold. 57% 11 Months Tenure of Attrited Customers 7 Months Outcome: Observing new Customer Attrition in First 12 m 20% 15% Attrition Rates 17%
Disguised Client Data Var_3 ÷ Var_4 + Var_2 x Var_3 Var_1 + Var_5 Signal x x Var_14 exp + x Var_19 log Var_11 Var_6 ÷ Var_7 Var_1 Securities Example - Securities Overview and Outcome Problem Statement A financial services client was interested in establishing the ability to accurately detect and predict securities buying signals in house. Current methods relied almost exclusively on general sector knowledge along with basic sector statistics and trend analysis provided by information vendors. Several quarters of daily trading data was provided for each security in a given sector. Transaction level revenue and subs renewal data were provided along with third part data appends. Solution A hybrid time series and machine learning model was developed to help detect and predict securities price movements which met the client’s internal criteria. Recommendations were made to compare results of securities decisioning over a 12 month period for the current approach versus the proposed method. solicit prospects whose expected revenue and tenure were sufficiently large enough to exceed acquisition costs by client’s internal threshold. Outcome: Tenure of new Customer attriting in First 12 m
Information services Example Disguised Client Data Distribution of Migrating Customers Across Segments Total # Migrating Customers – 5,193 Average Cluster Score: 4.03 1,326 belong to ‘low value’ Segment as they had most upward potential for increased product usage Product rank summary Overview and Outcome Top 5 products with increasing reach week to week Intensity Analysis Problem Statement An information services client was interested in establishing the ability to accurately measure the usage of its products across distinct customer segments in addition to the establishment of a robust segmentation scheme. Client also wanted to calculate and monitor the conversion likelihood of leads generated from its prospecting/lead gen efforts. Finally, the analysis was to be presented in the form of biweekly dashboard analysis reports. Solution A centroid based customer segmentation was developed and rescored biweekly to monitor customer migration across segments over time. Further, a conversion model was developed to estimate likelihood of conversion of leads maintained in their prospect base. Finally, an automated reporting framework was developed to generate the biweekly dashboard reports. Segmentation and Conversion Analysis Avg. Usage frequency by Cohort Sector research Intensity Search activity Alpha search 10 32 42 No. of searches 349 10 32 42 No. of searches 349 Zenith Search 10 32 42 No. of searches 349 Prime Search Comp Search 10 32 42 No. of searches 349