Download
1 / 11
110 likes | 209 Views
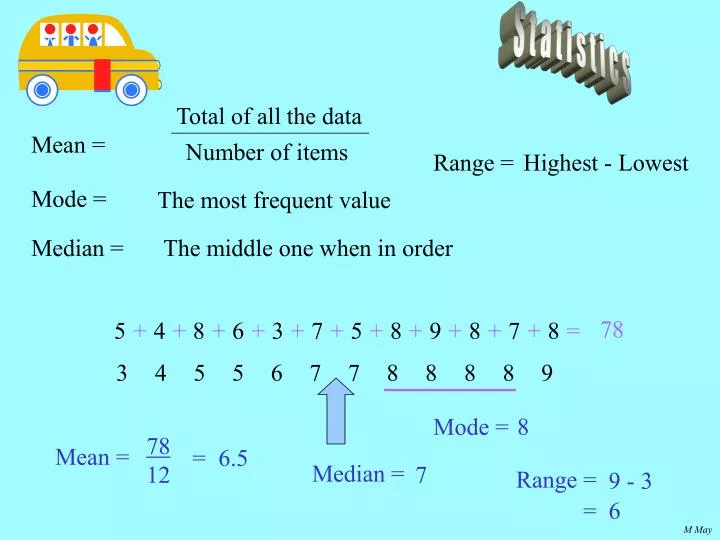
5. +. 4. +. 8. +. 6. +. 3. +. 7. +. 5. +. 8. +. 9. +. 8. +. 7. +. 8. =. Statistics. Total of all the data. Mean =. Number of items. Range =. Highest - Lowest. Mode =. The most frequent value. Median =. The middle one when in order. 78. 3. 4. 5. 5. 6. 7. 7.

E N D
5 + 4 + 8 + 6 + 3 + 7 + 5 + 8 + 9 + 8 + 7 + 8 = Statistics Total of all the data Mean = Number of items Range = Highest - Lowest Mode = The most frequent value Median = The middle one when in order 78 3 4 5 5 6 7 7 8 8 8 8 9 Mode = 8 78 12 Mean = = 6.5 Median = 7 Range = 9 - 3 = 6
f.x n 150 30 Mean = = = 5 Frequency Tables Data 4 3 8 3 5 4 5 4 7 2 6 5 6 3 7 5 2 6 4 7 3 8 6 4 3 4 6 7 8 5 4 3 8 3 5 4 5 4 5 Cumulative frequency 2 7 13 18 23 27 30 / / 2 / / / / 5 / / / / / 6 / / / / 5 / / / / 5 / / / / 4 3 / / / 30 Middle 15th/16th Mode = 4 6 most Median = 5
Scatter graph Graphs Bar graph Pie chart
Make a Pie chart x 36 360˚ x to calculate the size of the pieces of pie: 9 36 360˚ = 90˚ x 12 36 360˚ = 120˚ x 6 36 360˚ = 60˚ x Total = 36 360˚ yellow blue red green
• Make a Pie chart x 100 360˚ x to calculate the size of the pieces of pie: 15 100 360˚ = 54˚ x 20 100 360˚ = 72˚ x 25 100 360˚ = 90˚ x 5 100 360˚ = 18˚ x college / uni 35 100 full time 126˚ 360˚ = 126˚ x out of work 18˚ 54˚ 90˚ 72˚ training scheme part time all 100% represented by 360˚ of complete turn
Height 95 90 85 80 5 6 7 8 9 Age D B x x x x x x x x x x x x x x A C Scatter graph x x x x x x As age increases the height increases Is there a pattern in this scatter graph? Yes. line of best fit increasing decreasing
Height 95 90 85 80 5 6 7 8 9 Age 88 - 86 42 7 - 5 6 528 6 Scatter graph x x x o x x x (5, 86) (7, 88) = 1 m = = 2/2 H = 1 x A + c mean age = = 7 86 = 1 x 5 + c => c = 81 mean height = = 88 H = A + 81 is line of best fit
median means score of 14 marks 1 4 5 10 15 20 25 30 35 Stem and Leaf 17 16 9 19 14 23 20 18 19 21 Data 35 21 22 31 19 17 32 19 20 8 0 9 8 0 8 9 7 1 7 6 9 4 8 9 9 9 ) ( )( 1 4 6 7 7 8 9 9 9 9 2 3 0 1 1 2 0 )( 2 0 0 1 1 2 3 3 5 1 2 3 1 2 5 placed in order number of items n = 20 median = 19 = Q 2 mode = 19 key Range = 35 - 8 = 27 Lower Quartile Q1 = 17 Upper Quartile Q3 = 21.5
Standard deviation From a sample of data from each : x - x ) 2 √ s = n - 1 x x Roadside Rescue Auto Assist s = s = √ 508.67 √ 8006.67 11 11 = 6.8 = 27.0 = 436/12 = 36.33 = 400/12 = 33.33
Standard deviation From a sample of data : x - x ) 2 √ s = n - 1 = 400/12 = 33.33 = 436/12 = 36.33 s = = 27.0 s = = 6.8 √ 508.67 √ 8006.67 11 11 x x Roadside Rescue Auto Assist less variable slightly lower mean more predictable but much more variable but slightly higher mean
• • • • • • • • • • • • • • • • • • • • • 1 2 3 4 5 6 P r o b a b i l i t y 1 2 3 To predict the probability of an event, when outcomes are equally likely. Probability of an even number 3 = 1/2 P(even number) = 6 To estimate the probability of an event calculate the relative frequency of it for a sample. The larger sample, the better the estimate of probability. Shoe sizes bought in a shop one day 8 Rel freq of size 6 is = 35 Relative frequency 35 1 ( rounding error )