Download
1 / 16
160 likes | 358 Views
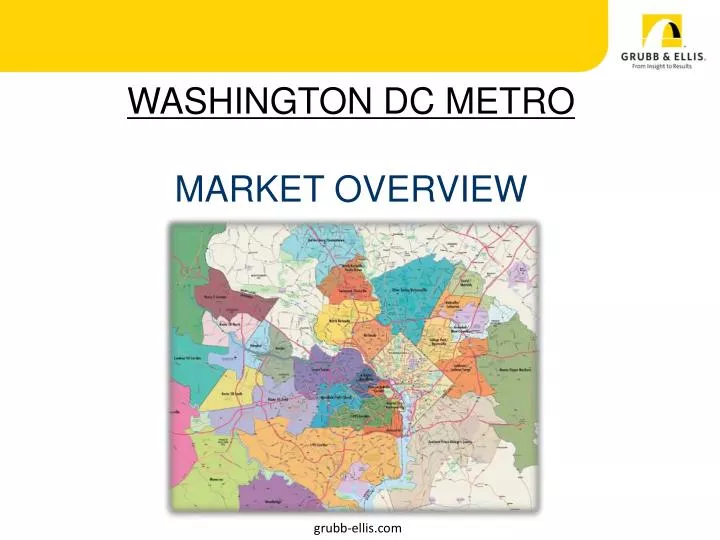
WASHINGTON DC METRO MARKET OVERVIEW www.grubb-ellis.com. 5. 5. grubb-ellis.com. Susan Pepper 2010 President GREATER WASHINGTON COMMERCIAL ASSOCIATION OF REALTORS Senior Vice President Grubb & Ellis Company. Greater Washington Office Market. Center of the Universe .

E N D
WASHINGTON DC METRO MARKET OVERVIEW www.grubb-ellis.com 5 5 grubb-ellis.com
Susan Pepper 2010 President GREATER WASHINGTON COMMERCIAL ASSOCIATION OF REALTORS Senior Vice President Grubb & Ellis Company
Greater Washington Office Market Center of the Universe • Total SF: 297,376,507* • Overall Vacancy: 14.9% • Year To Date Net Absorption: (1,007,442) • Under Construction: 7,931,938 SF • Average Asking Rental Rates • Class A: $39.97 • Class B: $30.90 * Stats compiled by Grubb & Ellis Research do not include Owner Occupied Buildings Source: Grubb & Ellis Research
D.C. Metro – Best of the Biggest Washington – 37,000
Unemployment Rate Year-End 10.2% 7.6% 6.2% Source: U.S. Bureau of Labor Statistics
Loss of Jobs Rising Vacancy But there’s more to it…
D.C. Metro Office Deliveries Square Feet (Millions) *Anticipated Deliveries Source: Grubb & Ellis Research, CoStar
D.C. Office Market Vacancy and Average Asking Rental Rates Dollars per Square Foot Vacancy Rate *Projection Source: Grubb & Ellis Research
Northern VA Office Market Vacancy and Average Asking Rental Rates Dollars per Square Foot Vacancy Rate *Projection Source: Grubb & Ellis Research
Suburban MD Office Market Vacancy and Average Asking Rental Rates Dollars per Square Foot Vacancy Rate *Projection Source: Grubb & Ellis Research
2009 at a Glance in Greater Washington 1st Quarter • Overall Vacancy: 13.5% • Net Absorption: (732,458) SF • Average Asking Rental Rates • Class A: $39.70 • Class B: $32.67 2nd Quarter • Overall Vacancy: 14.2% • Net Absorption: 72,759 SF • Average Asking Rental Rates • Class A: $40.01 • Class B: $31.75 3rd Quarter • Overall Vacancy: 14.9% • Net Absorption: (281,723) SF • Average Asking Rental Rates • Class A: $39.97 • Class B: $30.90 Source: Grubb & Ellis Research
Available Sublease Space Increasing at a Decreasing rate… Square Feet Source: Grubb & Ellis Research
D.C. Metro Investment Office Sales Volume (In Billions) * Projection Source: Real Capital Analytics, Grubb & Ellis
What would we do without foreign money? 1999 K Street – 249,000 SF Sale Price: $207.8 million Buyer: DekaImmobilien Investment Seller: Vornado Realty trust 1099 New York Avenue – 178,000 SF Sale Price: $90.5 million Buyer: Credit Suisse Seller: Tishman Speyer
GSA…YEA! GSA Regional Inventory of Leased Space (SF in Millions) *Projection Source: General Services Administration, Grubb & Ellis
Summary • Economic and job growth expected to continue in 2010 • New deliveries increased vacancy in Greater Washington • Rental Rates – relatively flat – major concessions to continue • Office Investment Sales expected to see an uptick in activity • Government leasing – drive market in 2010 • Don’t shoot the MESSENGER!