Download
1 / 15
150 likes | 304 Views
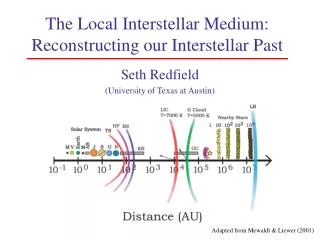
The Most Local Interstellar Medium. Jonathan Slavin Harvard-Smithsonian Center for Astrophysics. The Very Local ISM. In the nearest ~15 pc, 15 separate clouds have been identified (Redfield & Linsky 2008) Each cloud appears to be moving as a coherent entity – essentially as a rigid body –

E N D
The Most Local Interstellar Medium Jonathan Slavin Harvard-Smithsonian Center for Astrophysics
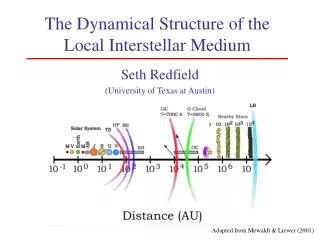
The Very Local ISM In the nearest ~15 pc, 15 separate clouds have been identified (Redfield & Linsky 2008) • Each cloud appears to be moving as a coherent entity – essentially as a rigid body – with small deviations indicating cloud-cloud interactions • Clouds have similar properties – warm (T~103-104K), low density (n~0.2 cm-3) • turbulent velocities are small 1 – 3 km s-1 Sky coverage of nearby clouds from Redfield & Linsky (2008) The nearby clouds in the Local Bubble show no signs of systematic expansion or contraction.
Comparison of predicted vs. observed radial velocity for LIC components Data from Redfield & Linsky (2008) on the velocity components associated with the Local Interstellar Cloud for their best fit velocity vector for the LIC. The quality of the fit shows that the LIC is dynamically stable. Inflow vector for the heliosphere is slightly discrepant with the LIC vector. heliosphere inflow vector
The Pressure of the LIC From observations and modeling of the ionization, density and temperature of the LIC we find a thermal pressure, P/k ≈ 2000 – 3000 cm-3 K Magnetic pressure is constrained by heliosphere models (see talk by Merav) and observations by Voyagers 1 & 2 – can't be much more than ~4000 cm-3 K Total thermal pressure in the hot gas of the Local Bubble cannot be more than ~7000 cm-3 K
The Ionization of the LIC EvidencethattheLIC is partially ionized comes from several fronts: • absorption line data: • N(MgI)/N(MgII) (with observed/modeled FUV flux) gives ne= 0.05 – 0.1 cm-3 • X(H+) ≈ 1 – N(OI)/N(SII) AS/AO gives ~20-30% ionization – other ratios yield similar results • heliosphere models constrain X(H+), nH, ne – find that X(H+) ≈ 0.25, nH≈ 0.24 cm-3 is needed • EUVE data give NI(H)/N(HeI) ~10– 14 → He at least as ionized as H • in situ observations find n(He0) = 0.015 cm-3
Explanations for LIC Ionization • Photoionization by starlight – no nearby O stars – brightest sources are ε CMa, β CMa plus several WDs – can't ionize He enough • Shock – Would lead to non-equil. ionization and might explain He ioniz., but predicts higher ionization for observed T (cooling is too fast) • Soft X-ray emission from the Local Bubble – hard enough to explain He ionization, but to get enough photons need high P • Interface of hot LB and cloud(s) – has right hardness and enough flux but possible problems with observational constraints, O VI, Si III, CHIPS
Photoionization by Starlight Vallerga (1998) combined EUVE data on ε CMa, β CMa (both B stars) and all the nearby WDs (54 in all). Above 504Å HeI edge, spectrum is dominated by ε CMa, and below the edge it's dominated by Feige 24, HZ 43 and G191-B2B. Vallerga used these data to calculate a simple 1-D photoionization model. He showed that the stellar flux falls far short providing the inferred ionization for He given that N(HI)/N(HeI) > 10. Photoionization by starlight can maybe account for ne but not He ionization.
Shock Ionization of the LIC Lyu & Bruhweiler (1996) proposed to explain the H and He ionization of the LIC by non-equilibrium ionization – delayed recombination – after a shock. This seemed to work, but they did not consider the thermal evolution, assuming rapid cooling to 104 K with no further cooling. LIC Temperature Substantial heating is needed to maintain the gas at the observed T~ 6000 K. If allowed to cool, the observed ionization, X(H+) ~ 0.2, won't be reached until T reaches ~ 4000 K. The strength of cooling in these conditions requires that the gas is near thermal equilibrium. LIC H Ionization Time evolution of temperature and H ion fraction behind a 100 km/s shock (J. Raymond private communication)
Photoionization of the LIC by the SXRB • Our photoionization modeling shows: • SXRB alone can account for the ionization and the heating of the gas in the LIC • But only if the thermal pressure is much larger than the total pressure inferred for the LIC • And SWCX is not a substantial fraction of the background. For standard Raymond & Smith code collisional ionization equilibrium model we find a H ionization rate at the Sun of ~ 4.5×10⁻¹⁵ s-1 for log T = 6.0 (with ½ distant emission, ½ local).
Emission from an Evaporative Boundary to the LIC • If the LIC is evaporating into the Local Bubble, strong EUV emission is generated in the boundary. Our models include: • non-equilibrium ionization • radiative cooling • heat flux saturation • magnetic pressure (B∝n) • reduced conductivity (0.5) because of magnetic field geometry. • pre-ionization of cloud gas • Steady flow is assumed. B0 = 2 μG B0 = 5 μG Profiles of dynamical variables for cloud boundary calculations with B0 = 2 and 5 μG. Higher B in the cloud means higher total pressure in the cloud. Since thermal pressure dominates in the hot gas, higher B implies higher thermal pressure in LB.
Model Ionizing Spectrum • We construct the model ionizing spectrum from • Vallerga's EUVE composite spectrum – extrapolated to 912Å • FUV spectrum (observed/modeled) from Gondhalekar et al. (1980) • R&S CIE model spectrum – we explore log T = 5.9, 6.0 and 6.1 with ½ absorbed by N(HI) = 1019 cm-2 and ½ unabsorbed • Evaporative cloud boundary emission Model 26 spectrum in Slavin & Frisch (2008, A&A, in press) Cloud boundary emission is fixed by the model – Local Bubble emission is scaled so that total emission in the B band matches all-sky average. For low B0 models the low pressure in the LB makes them inconsistent with the size of the Local Cavity.
Radiative Transfer/Ionization Results • The model ionizing spectrum is used as input for the thermal equilibrium/radiative transfer code Cloudy (Ferland et al 1998). We find: • observed He density and temperature can be matched for selected model parameters • H, He are ~ 20 – 40 % ionized with He more ionized than H • models without a cloud boundary component with 1 exception do not produce enough flux to ionize and heat the cloud. • Reducing the SXRB component still allows for a successful model; so far we have tested 25% reduction – work in progress Results of model for ε CMa line of sight
More Implications of Evaporative Cloud Boundaries The cloud model appears to work as a source of EUV flux, but how can it be tested? High ions, in particular O VI, have generally been thought to provide the tightest constraints on these models. Our current models predict low values for N(O VI) and also broad profiles offset from the cloud velocity – difficult to observe. Si III from cloud boundary also predicted to be small – whereas on some lines of sight it appears strong – may be clue to different type of interface.
More Possibilities... • Thermal conduction is not the only physical process that may be important in the interface. In reality we might have • shear flow, and turbulent mixing • multiple cloud interfaces – reduces evaporation rate • magnetic reconnection • all of the above Comparison of cloud evolution in a shear flow with and without thermal conduction. Conduction strongly reduces turbulent mixing but increases mass loss rate.
Conclusions • The inferred thermal pressure and constraints on the magnetic pressure yield a total pressure of P/k ~ 2000 – 7000 cm-3 K for the LIC • The lack of any signature of expansion or contraction in the LIC indicates that whatever fills the Local Bubble must have a pressure close to that of the LIC • Both the ionization and heating of the LIC requires a relatively strong source of photons • The ionization cannot be explained by the starlight available – some combination of hot gas and interface emission is most plausible source, especially for He ionization