Download
1 / 33
330 likes | 339 Views
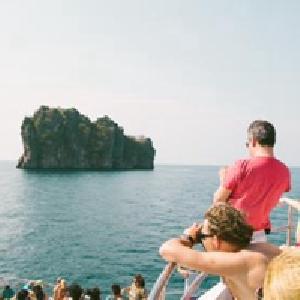
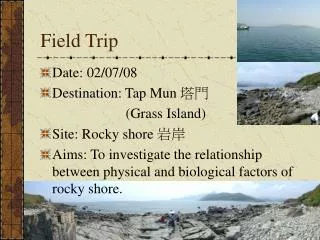
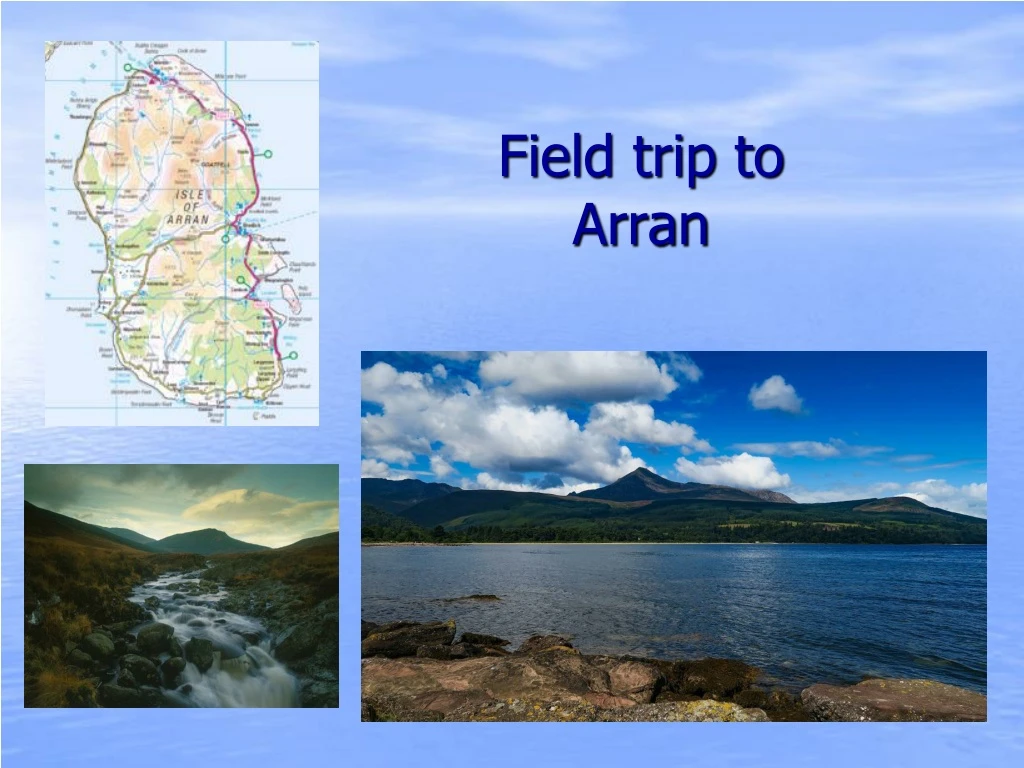
Field trip to Arran. Location of Study Area The Isle of Arran lies off the south west coast of Scotland. Ferry from Ardrossan to Brodick. Arrive in Brodick. We will be staying at the Youth Hostel in Lochranza. O ur walk will start from the car park at Sannox.

E N D
Location of Study AreaThe Isle of Arran lies off the south west coast of Scotland
We will stop at 7 sites to take measurements Site 7 Site 4 Site 1
The walk will allow us to see some of Scotland’s finest glaciated scenery…
Higher Geography Assignment
Learning Intentions: • To produce a project for the assignment I will be able to: • Carry out research on my chosen topic • Process the information gathered • Produce a final report for the assignment
Questions • Does the river Sannox match Bradshaw’s model of a river? • Do the characteristics of the River Sannox change as you move downstream? • What are the affects of tourism on Arran? • Are there negative affects of tourism on Arran as well as positive? • Or your own!
Introduction • Set the scene – why are you doing this fieldwork? What do you hope to achieve at the end of it etc. • This should lead into the research methods section. • A brief introduction is all that is needed.
Research Methods • You should describe the methods you used to gather the data e.g. measuring speed, width and depth of the river, pebble analysis etc. • Describe in detail how you carried out the process as well as advantages/disadvantages of each method used (evaluation).
Knowledge • You will be expected to show a detailed knowledge and understanding of your topic or issue. It is expected that you will have learned a lot about it as you carry out your research. • This can be included in the introduction or as you complete your analysis. • It may be: background, why its important, knowledge of a model, awareness of different view points etc.
Structure • At higher level you should be able to write in a coherent way and communicate your information clearly to the reader. • It should clearly show how you have reached your conclusion. • You should use correct terminology, diagrams, headings and titles etc.
Analysis Stage 1: Begin by making simple and straightforward statements about what each figure shows. Quote numbers, values or other evidence to support the statements. Try to identify the most significant information e.g. largest, the smallest – differences between etc.
Analysis • Stage 2: Then add more detail and explain. Give reasons for what each figure shows.
Analysis • Stage 3: Extend the analysis (higher grade). Try to identify patterns. For two sets of data say in what ways the two are related? How strong is the relationship? Why do data links occur?
Example! • As you can see in graph 1, the width of the river became wider downstream, ranging from 0.33m at Site 1 to 1.23m at Site 3, almost four times as wide. Site 1 was in the upper course and Site 3 was in the lower course. This is typical of a river as the processes of erosion are wearing down the banks of the river channel. Hydraulic action, where the force of the water erodes the banks of the river by its sheer force, is most powerful in the lower course. So too, is the process of corrasion, where the rocks and stones being carried by the river are thrown against the sides and base, eroding them further. These processes will cause the river to become wider downstream.
Conclusion The main purposes of this section are: • To look at all the work done • To link the results to the original aims of the assignment. • To draw overall conclusions. • To place your work in its broader geographical setting. • To evaluate the strengths and weaknesses of the work as a whole.
Marks allocation – National 5 • Research – 6 marks • Analysis and conclusion - 14
Marks allocation - Higher • Research – 6 marks • Processed Information – 6 marks • KU – 6 marks • Analysing – 8 marks • Conclusion – 2 marks • Communicating Information – 2 marks
Information we will gather • Speed, depth, width • Friction (internal and external) • Bedload • Discharge
Speed, depth and width • These measurements will be taken across the river at 0.5m intervals and then an average will be calculated
Friction • Tables will be used here to allocate a mark from 1 to 5 for both internal and external friction.
Bedload • Callipers will be used to measure the A, B and C axis of the rock taken from the river. • 10 rocks will be taken and measured from each of the 3 sites • The table to the right will be used to determine the overall shape.
Discharge Discharge will be calculated using the following calculation: Discharge = cross-sectional area x average speed Cross-sectional area = average depth x width
Processing the data gathered • Cross-section of the river at sites 1 – 7 • Line graphs showing width, depth and speed • Relationship graphs showing: speed / discharge speed / friction • Tables showing ave. size and shape of bedload • Table showing friction