Download
1 / 57
580 likes | 607 Views
Production and Cost Analysis I. Chapter 9. Introduction. In the supply process, people first offer the factors of production they control to the market. Then the factors are transformed by firms into goods that consumers want.

E N D
Production and Cost Analysis I Chapter 9
Introduction • In the supply process, people first offer the factors of production they control to the market. • Then the factors are transformed by firms into goods that consumers want. • Production occurs when factors of production (inputs) transform into goods and services.
Firms Maximize Profit • Firm’s goal is to maximize profit. • Profit is the difference between total revenue and total cost. Profit = Total revenue – Total cost
Firms Maximize Profit • An accountant will calculate profit by subtracting explicit costs from the revenue. • For an economist,the measure of profit is revenues minusbothimplicit and explicit costs.
Firms Maximize Profit • Implicit costs include the opportunity costs of the factors of production. Economic profit = Revenue – (Implicit costs +Explicit costs)
The Production Process • The production process is generally divided into a long run planning decision and the short runadjustment decision.
The Long Run and the Short Run • A long-run decision is a decision in which the firm can choose the least expensive method of producing from among all possible production techniques.
The Long Run and the Short Run • A short-run decision is one in which the firm is constrained by past choices in regard to what production decisions it can make.
The Long Run and the Short Run • The terms long run and short run do not necessarily refer to specific periods of time. • They refer to the degree of flexibility the firm has in changing the level of output.
The Long Run and the Short Run • In the long run: • By definition, the firm can vary the inputs as much as it wants. • All inputs are variable.
The Long Run and the Short Run • In the short run: • Flexibility is limited. • Some factors of production cannot be changed. • Generally, the production facility (“the plant”) is fixed in the short run.
Production Tables and Production Functions • How a firm combines factors of production to produce consumer goods can be presented in a production table. • A production table shows the output resulting from various combinations of factors of production or inputs.
Production Tables and Production Functions • Most of the production decisions firms make are short run decisions involving changes in output at a given production facility. • The firm can increase or decrease production by adjusting the amount of variable inputs, such as labour or materials.
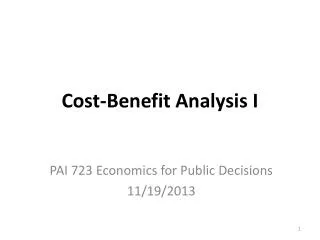
Production Tables and Production Functions • Total product is the number of units of the good or service produced by a different number of workers.
Production Tables and Production Functions • Marginal product is the additional output that will result from an additional worker, other inputs remaining constant. • Average product is calculated by dividing total output by the number of workers who produced it.
Production Tables and Production Functions • The information in a production table is often summarized in a production function – a curve that describes the relationship between the inputs (factors of production) and outputs.
Production Tables and Production Functions • The production function discloses the maximum amount of output that can be derived from a given number of inputs.
Number of workers Total output Marginal product Average product 0 0 — Increasing marginal productivity 4 1 4 4 6 2 10 5 7 3 17 5.7 6 4 23 5.8 Diminishing marginal productivity 5 28 5.6 5 3 31 5.2 6 1 32 4.6 7 0 32 4.0 8 Diminishing absolute productivity 2 30 3.3 9 5 10 25 2.5 A Production Table, Figure 9-1a, p 203
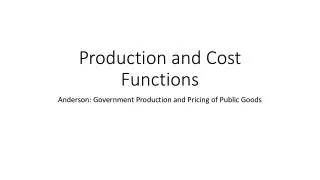
Diminishing marginal productivity Diminishing marginal productivity Diminishing absolute productivity Diminishing absolute productivity 32 7 30 28 6 26 24 TP 5 22 20 Increasing marginal productivity 18 4 Output 16 Output per worker 14 3 12 10 2 8 AP 6 1 4 2 0 0 1 2 3 4 5 6 7 8 9 10 1 2 3 4 5 6 7 8 9 10 MP Number of workers Number of workers (a) Total product (b) Marginal and average product A Production Function, Figure 9-1b and c, p 203
The Law of Diminishing Marginal Productivity • The law of diminishing marginal productivity is an important element in all real-world production processes. • Both marginal and average productivities initially increase, but eventually they both decrease.
The Law of Diminishing Marginal Productivity • This means that initially the production function exhibits increasing marginal productivity. • Then it exhibits diminishing marginal productivity. • Eventually, the production function exhibits negative marginal productivity.
The Law of Diminishing Marginal Productivity • The most important part of the production function is the part exhibiting diminishing marginal productivity and falling average product.
The Law of Diminishing Marginal Productivity • The law of diminishing marginal productivity states that as more and more of a variable input is added to an existing fixed input, after some point the additional output obtained from the additional input will fall.
The Costs of Production • Costs of production in the short run are: • Fixed Costs, • Variable Costs, and • Total Costs.
Fixed Costs, Variable Costs, and Total Costs • Fixed costs are those that are spent and cannot be changed in the period of time under consideration. • In the long run there are no fixed costs since all costs are variable.
Fixed Costs, Variable Costs, and Total Costs • Variable costs are costs that change as output changes, such as the costs of labour and materials.
Fixed Costs, Variable Costs, and Total Costs • The sum of the variable and fixed costs are total costs: TC = FC + VC
The Costs of Production • Besides total costs, firms are concerned with their costs per unit of output. • Per unit costs are • Average Total Cost, • Average Fixed Cost, and • Average Variable Cost
Average Costs • Average total cost (often called average cost) equals total cost divided by the quantity produced. ATC = TC/Q
Average Costs • Average fixed cost equals fixed cost divided by quantity produced. AFC = FC/Q
Average Costs • Average variable cost equals variable cost divided by quantity produced. AVC = VC/Q
Average Costs • Since total cost is the sum of fixed and variable costs, • Average total cost is the sum of average fixed cost and average variable cost ATC = AFC + AVC
Marginal Cost • Marginal cost is the change (increase) in total cost from a change (increase) in output by one unit. MC = TC/Q
Graphing Cost Curves • To gain a better understanding of the costs concepts, we can illustrate them by drawing a graph. • Quantity is plotted on the horizontal axis and a dollar measure of various costs on the vertical axis.
Total Cost Curves • The total variable cost curve has the same shape as the total cost curve—increasing output increases variable cost.
TC VC L O M FC Total Cost Curves, Fig. 9-2a, p 207 $400 350 300 TC = (VC + FC) 250 Total cost 200 150 100 50 0 2 4 6 8 10 20 30 Quantity of earrings
Average and Marginal Cost Curves • Marginal cost, average cost and average variable cost curves are U-shaped. • The marginal cost curve will intersect the average total cost curve and the average variable cost curve at their minimum points.
Average and Marginal Cost Curves • The average fixed cost curve slopes down continuously.
Downward-Sloping Shape of the Average Fixed Cost Curve • The average fixed cost curve looks like a child’s slide – it starts out with a steep decline, then it becomes flatter and flatter. • It tells us that as output increases, the same fixed cost can be spread out over a wider range of output.
The U Shape of the Average and Marginal Cost Curves • In the short-run, output can only be increased by increasing the variable input.
The U Shape of the Average and Marginal Cost Curves • As more and more variable input is added to a fixed input, the law of diminishing marginal productivity sets in. • Marginal and average productivities fall and marginal costs rise.
The U Shape of the Average and Marginal Cost Curves • And when average productivity of the variable input falls, average variable costs rise.
The U Shape of the Average and Marginal Cost Curves • The average total cost curve is the vertical summation of the average fixed cost curve and the average variable cost curve, so it is always higher than both of them.
The U Shape of the Average and Marginal Cost Curves • If the firm increased output enormously, the average variable cost curve and the average total cost curve would almost meet.
$30 28 26 24 22 20 18 16 MC 14 Cost ATC 12 AVC 10 8 6 4 2 AFC 0 2 4 6 8 10 12 14 16 18 20 22 24 26 28 30 32 Quantity of earrings Per Unit Cost Curves, Figure 9-2b, p207
The Relationship Between Productivity and Costs • The shapes of the cost curves are mirror-image reflections of the shapes of the corresponding productivity curves.
The Relationship Between Productivity and Costs • When one is increasing, the other is decreasing. • When one is at a maximum, the other is at a minimum.
$18 9 16 8 MC 14 7 AVC 12 6 A 10 5 8 4 AP 6 3 4 2 MP 2 1 Labour 0 12 Output 0 21/2 4 The Relationship Between Productivity and Costs,Fig. 9-3, p208 Output per worker Costs per unit 21 a) b)
Relationship Between Marginal and Average Costs • The marginal cost and average cost curves are related. • When marginal cost exceeds average cost, average cost is rising. • When marginal cost is less than average cost, average cost is falling.