Download
1 / 19
200 likes | 315 Views
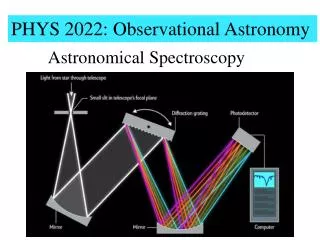
Observational Astronomy. SPECTROSCOPY and spectrometers. Kitchin, pp. 310-370. Spectroscopic methods. Different purposes require different instruments Main spectroscopic methods: Low resolution Long slit, high resolution High resolution

E N D
Observational Astronomy SPECTROSCOPYandspectrometers Kitchin, pp. 310-370
Spectroscopic methods • Different purposes require different instruments • Main spectroscopic methods: • Low resolution • Long slit, high resolution • High resolution • Spectroscopic observations are characterized by: dispersion/spectral resolution and spectral range
Low-resolution • Typical goal: search for objects with specific spectral features • Method 1: objective prism, telescope "sees" the source through a prism, therefore each point source looks like a small spectrum • Method 2: spectrophotometry - narrow band filters for given spectral features. Often, such filters have the possibility to change central wavelength by changing temperature/pressure. There is no slit!
Objective prism spectra Spectrum of Vega taken with objective prism. Theoretical model is shown in color. Sky viewed through a prism. White box marks a single spectrum
Spectrophotometry Spectral energy distribution as a function of stellar temperature Spectral energy distribution as a function of stellar surface gravity
Fabry-Perot interferometer Continuum H alpha Each ring corresponds to one wavelength. Position of each ring depends on the gap d. Velocity field H alpha profiles
Grating spectroscopy ESO HARPS spectrometer uses two echelle gratings aligned to a few nanometers
Blaze angle W Gratings Conventional grating Interferencebetweengrooves Grating formula: Echelle grating ath ifference ptical
Collimator Grating Slit Camera Detector Grating spectrometers Simplified view of a grating spectrometer: Slit Collimator Grating Camera Detector
A bit of math: • Expression for angular dispersion is found by differentiating the grating eq.: • Linear dispersion is readily obtained for a given focal length Angular dispersion Linear dispersion
… and some more … • Angular resolution. Think of a grating as a mirror, its diffraction angle is given by: • … and combining it with the angular dispersion equation: • Resolving power depends in the number of illuminated grooves! Projected size of the grating ?
Free spectral range The free spectral range (FSR) of a diffraction grating is defined as the largest bandwidth in a given order which does not overlap the same bandwidth in an adjacent order. Order m-1 Order m Order m+1 For a prism FSR is the whole spectral range!
Real world: the seeing and the pixel size • The angular slit size as seen by the grating is:where is the focal length of the collimator and s is the linear width of the slit. Grating equation connects this to the angular resolution element. For a fixed wavelength: • If we try to match this to the angular resolution of the grating we end up with too narrow slits. • In practice, we select the slit, translate this to angular resolution and select the camera focal length to match the pixel scale.
Putting some numbers Home work The spectrograph for the BWT is based on a 20 cm grating with a blaze angle of 66.5º and 72 grooves per mm • Find angular resolution of the grating at 4000 Å, 6000 Å and 8000 Å • Optimal slit size with collimator length of 80cm • Take a realistic seeing (2”) and the corresponding entrance slit size. Compute the resolution and the camera focal length to have 3 pixel sampling of resolution element (15 micron pixel size) • Why is it hard to make high-resolution spectrometers for large telescopes? How the size of the primary mirror affects parameters of a spectrometer?
Modern concept • Echelle gives high resolving power (high orders) and high efficiency (no dark stripes) • Spectral orders overlap (maximum reflection at blaze angle) order selection or cross-disperser is needed (e.g. grating or prism) • Central wavelength of order m is given by: • With a cross-disperser the whole spectrum is packed in a rectangular 2D format, perfect for an electronic detector
Spectrograph designs Echelle, white pupil scheme (e.g. FEROS) This spectrometer consists of two well separated parts helping reducing scattered light and matching resolution with pixel size
Echelle focal plane layout Thorium Argon emission line spectrum
Side effects • Orders are curved • Order spacing changes • Short FSR • Camera aberrations directly affect resolution • Strong fringing
Other spectroscopic instruments • IFU instruments2D image slices are re-arranged in 1D slit. E.g. SINFONI • Multi-object instruments.E.g. FORS, FLAMES