Download
1 / 58
580 likes | 730 Views
Grain and Oilseed Outlook. Omaha Ag Outlook Omaha, Nebraska Dec. 7, 2013 Chad Hart Associate Professor/Crop Markets Specialist chart@iastate.edu 515-294-9911. U.S. Corn Supply and Use. Source: USDA-WAOB. U.S. Soybean Supply and Use. Source: USDA-WAOB. Projected Corn Yields.

E N D
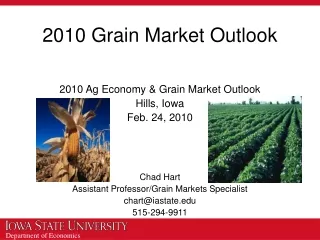
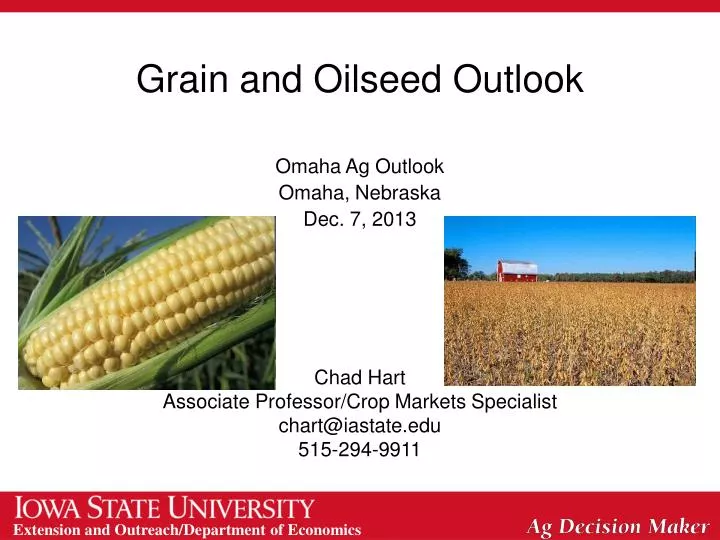
Grain and Oilseed Outlook Omaha Ag Outlook Omaha, Nebraska Dec. 7, 2013 Chad Hart Associate Professor/Crop Markets Specialist chart@iastate.edu 515-294-9911
U.S. Corn Supply and Use Source: USDA-WAOB
U.S. Soybean Supply and Use Source: USDA-WAOB
Projected Corn Yields Top: 2013 Projected Yield Bottom: Change from last month Units: Bushels/acre Source: USDA-NASS
Projected Soybean Yields Top: 2013 Projected Yield Bottom: Change from last month Units: Bushels/acre Source: USDA-NASS
World Corn Production Source: USDA-WAOB
World Soybean Production Source: USDA-WAOB
U.S. Meat Production & Prices Source: USDA-WAOB
Corn Export Shifts Source: USDA-FAS
Corn Export Sales Source: USDA-FAS
Soybean Export Sales Source: USDA-FAS
Soy Export Shifts Source: USDA-FAS
Current Corn Futures 4.39 4.28 4.17 Source: CME Group, 12/4/2013
Current Soybean Futures 12.42 11.01 10.86 Source: CME Group, 12/4/2013
Corn Prices vs. Costs Per Bushel Cost calculated as Per Acre Cost from ISU Extension divided by Actual Yield per Acre Sources: USDA-NASS for Prices, Duffy for Costs
Soybean Prices vs. Costs Per Bushel Cost calculated as Per Acre Cost from ISU Extension divided by Actual Yield per Acre Sources: USDA-NASS for Prices, Duffy for Costs
Crop Acreage Source: USDA-NASS
Crop Shifts Source: USDA-NASS
Thoughts for 2014 and Beyond • Supply/demand concerns • Corn demand rebounding? Yes, so far, so good • Acreage allocation for 2014: Where do the extra corn acres go? • Markets favoring soybeans in the short term and corn longer term
World Corn Markets Source: USDA
Thank you for your time!Any questions?My web site:http://www.econ.iastate.edu/~chart/Iowa Farm Outlook:http://www.econ.iastate.edu/ifo/Ag Decision Maker:http://www.extension.iastate.edu/agdm/
U.S. Wheat Supply and Use Source: USDA-WAOB
Winter Wheat Acreage Source: USDA-NASS
Winter Wheat Production Top: 2013 Projected Production Bottom: % Change from last year Units: Million bushels Source: USDA-NASS
Durum Wheat Production Top: 2013 Projected Production Bottom: % Change from last year Units: Million bushels Source: USDA-NASS
Other Spring Wheat Production Top: 2013 Projected Production Bottom: % Change from last year Units: Million bushels Source: USDA-NASS
World Wheat Production Source: USDA-WAOB
Wheat Export Pace Source: USDA-FAS
Wheat Export Shifts Source: USDA-FAS
Current Wheat Futures 6.86 6.54 6.45 Source: CME Group, 12/6/2013
Iowa Crop Shifts Source: USDA-NASS
Liquid Fuel Usage Source: DOE-EIA
Carry vs. Costs Carry shows the additional revenue that can be obtained from holding on to the crop But there are costs to holding on: storage interest/opportunity costs These are known as the cost of ownership
Building a Marketing Plan 5 basic steps: • Estimate number of bushels/animals to sell • Calculate breakeven price • Project price and production scenarios • Compare pricing tools and analyze market opportunities • Develop a pricing plan
Marketing Types • Harvest • Averaging • Price Target • Time and Price • Extended Time and Price
Iowa Land Values Source: Mike Duffy, ISU
Iowa Land Values – Log Scale Source: Mike Duffy, ISU