1 / 1

LSF09

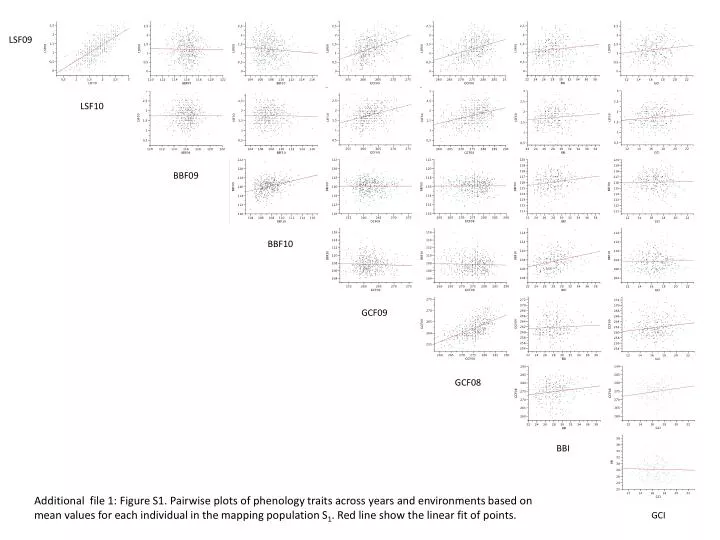
LSF09. LSF10. BBF09. BBF10. GCF09. GCF08. BBI. Additional file 1: Figure S1. Pairwise plots of phenology traits across years and environments based on mean values for each individual in the mapping population S 1 . Red line show the linear fit of points. GCI.

Download Presentation

LSF09

An Image/Link below is provided (as is) to download presentation Download Policy: Content on the Website is provided to you AS IS for your information and personal use and may not be sold / licensed / shared on other websites without getting consent from its author. Content is provided to you AS IS for your information and personal use only. Download presentation by click this link. While downloading, if for some reason you are not able to download a presentation, the publisher may have deleted the file from their server. During download, if you can't get a presentation, the file might be deleted by the publisher.

E N D

Presentation Transcript


  1. LSF09 LSF10 BBF09 BBF10 GCF09 GCF08 BBI Additionalfile 1: FigureS1. Pairwiseplotsof phenology traitsacrossyears and environmentsbased on meanvalues for eachindividual in the mapping population S1. Red line show the linear fit ofpoints. GCI

More Related